Индикатор
Indices
Prop
Commodities
Stocks
Forex
Crypto
Логотип продукта "IRiskRewardTools"
15/12/2025
5
Desktop
С 30/09/2024
Продажи
43
Загруженное изображение продукта "IRiskRewardTools"Загруженное изображение продукта "IRiskRewardTools"Загруженное изображение продукта "IRiskRewardTools"Загруженное изображение продукта "IRiskRewardTools"Загруженное изображение продукта "IRiskRewardTools"

This indicator is a risk management tools. The details are as follows:

1) Order Type: Limit Order, Market Order, Stop Order;

2) Risk Method: Fixed Amount (for example, $200, user can input), Percentage of Account Balance (for example, 1%, user can input);

3) Risk-Reward Ratio: User can input this value, for example triple profits. The system automatically calculates the tradable lot size, entry price, stop-loss pips and price, and take-profit pips and price based on the set values;

4) Entry Price: Defaults to the current price of the current instrument, user can modify and input manually;

5) Stop Loss Pips: Defaults to the 10 * symbol spread (user can modify and input manually);

6) Lot Size: Automatically calculated;

7) Take Profit: Automatically calculated (including pips and price);

8) Stop Loss Price: Automatically calculated.

At the bottom of the interface are "Place Order" buttons to execute order placement operations based on the above parameter settings.


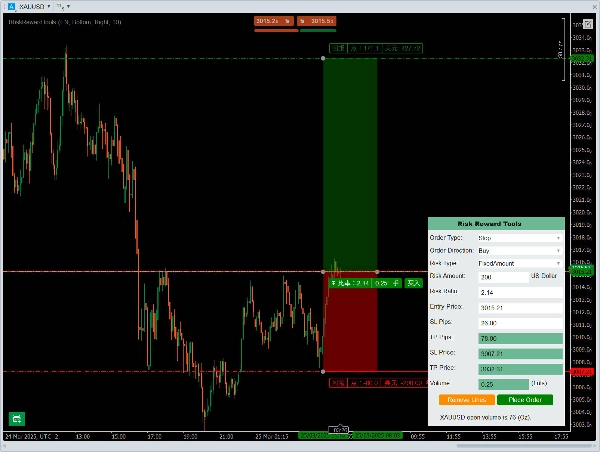
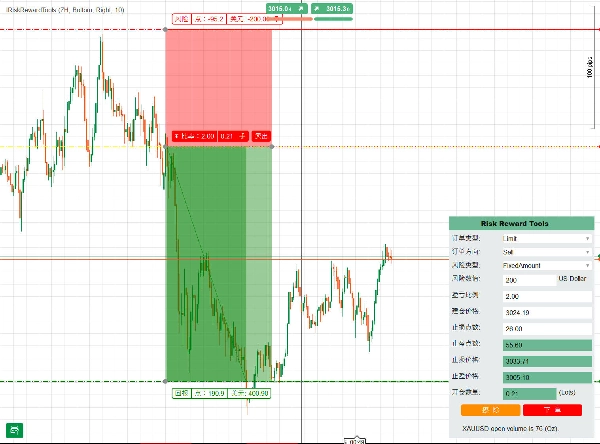
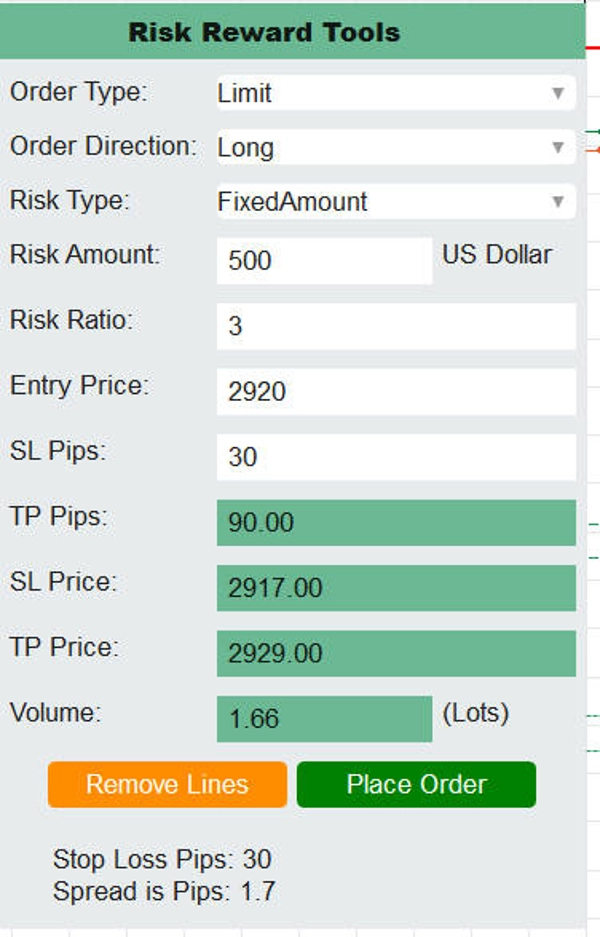
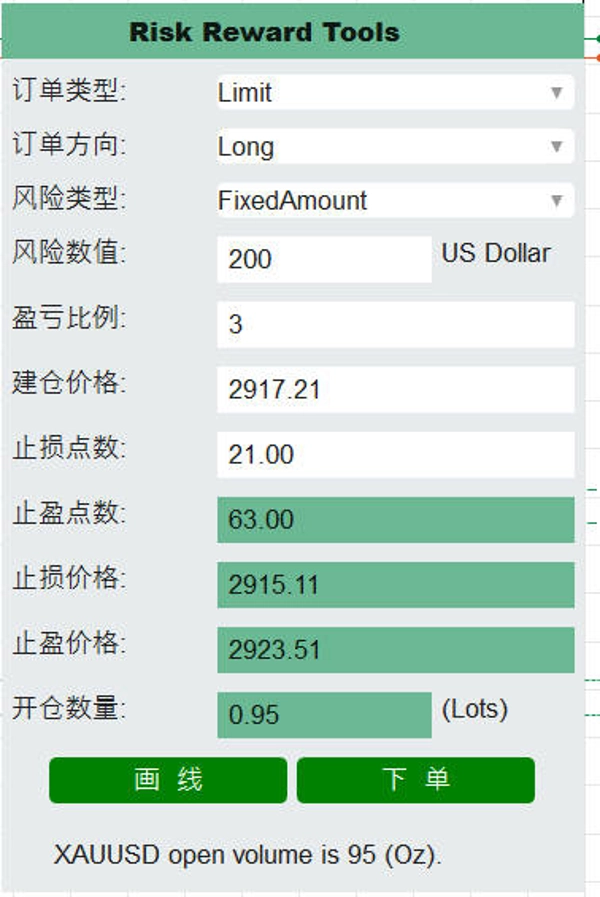
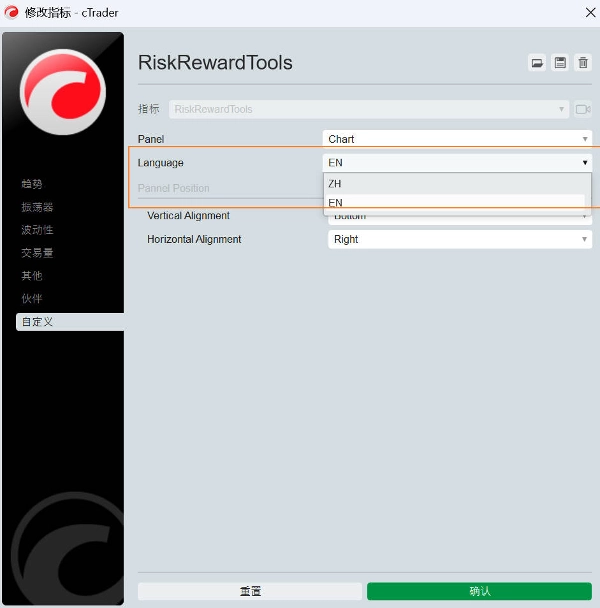
首先,这个指标是一个风险管理工具,用户界面有各种输入控件,如下拉菜单、文本框和按钮,用于计算订单的手数、止损、止盈等参数。用户可以选择订单类型(限价、市价、止损)、方向(多空)、风险类型(固定金额或百分比),输入风险值、风险回报比、建仓价格,然后计算相应的止损价格,止盈点数、价格,以及手数,并提供下单功能。说明如下:

1) 订单类型:限价单,市价单,止损单:

2) 风险方式:固定金额(比方200美元,用户可输入),账户余额百分比(比方1%,用户可输入);

3) 盈亏比:用户可以自行输入,比方3倍。系统根据设置值,自动计算可开仓手数,开仓价格,止损点数和价格,止盈点数和价格;

4) 建仓价格:默认是当前品种的当前价格,用户可自行修改输入;

5) 止损点数:输入止损点数,自动计算开仓手数,止损价格,止盈价格等信息,并可通过画线功能在图表上看相关位置信息;

6) 开仓手数:自动计算;

6)止盈:自动计算(包括点数和价格);

7)止损:自动计算(包括点数和价格)。

界面最下方是“下单”按钮,实现对上述参数设置的执行下单操作。请看视频介绍:

0.0
Отзывы: 0
Отзывы покупателей
У этого продукта еще нет отзывов. Уже попробовали его? Поделитесь впечатлениями!
Больше от этого автора
Индикатор
Indices
Breakout
Prop
+4
Pivot Points Daily Session
Pivot Point with base zone daily Asia-London-New york Session.
Популярный
$ 15
/
$19
Индикатор
RSI
Indices
Prop
+6
The ZigZag indicator is a technical analysis tool primarily used to identify key price reversal points.
Индикатор
VWAP
Indices
Prop
+4
Volume Weighted Average Price
VWAP is a powerful tool for intraday traders
Индикатор
Indices
Breakout
Prop
+4
Higher TimeFrame Candle Tracker
Higher TimeFrame Candle Tracker: Current Timeframe (Any TimeFrame) Show High TimeFrame Candle Bar
Индикатор
Indices
RSI
Prop
+4
This is a super indicator that integrates the RSI indicator with a dual moving average system.
Индикатор
Indices
Breakout
Commodities
+3
Daily Levels
The "Daily Levels" indicator is used to display last week's and yestoday high/low price
Вам также может понравиться
Индикатор
Grid
NAS100
RSI
+19
Delta-RSI Candle Pro
Delta RSI Candle Pro
Индикатор
Grid
Breakout
Martingale
+10
Sync vertical lines automatically between multiple charts of the same symbol. Mark once — see it everywhere. Ideal for m
Индикатор
NAS100
NZDUSD
Martingale
+26
Order Block detector PRO
Order Block PRO — Smart Institutional Zone Detector
Популярный
$ 15
Parabolic RSI Alert  V1
Master RSI reversals with Parabolic SAR precision! Get real-time alerts for high-probability trend changes.
Simple Pivot Points
Clear pivot levels. Clean S/R zones. Five methods. Any timeframe.
Индикатор
Indices
Prop
Stocks
+5
Elliott Wave Structure Pro v2.0 (Non-Repainting) Structure, Elliott, Continuation Entries
Индикатор
Indices
Prop
Stocks
+8
Fibo Tracer
The One — full control over timing and levels, the point where my market feeling shifted from a game to real structure.
Индикатор
NAS100
Indices
NZDUSD
+9
VMM Sessions Pro
Professional session for Forex markets with visual overlays, alerts, timezone support, and kill zones.
Simple MACD Histogram
Simple MACD Histogram with color-coded rising (green) and falling (red) momentum bars.
Индикатор
NAS100
NZDUSD
Breakout
+13
This Indicator will show you Direction, Distance, and Time;
Overlay HTF context on any chart: color bars by HTF and draw filled HTF bodies with optional High/Low lines.