
Описание
Основная цель:
Картирование распределения объема по уровню цены для выявления:
Областей высокой ликвидности
Областей низкой ликвидности
Дисбалансов между покупателями и продавцами
Этот индикатор мощный для понимания структуры рынка и выявления зон с высокой вероятностью для операций! 🎯
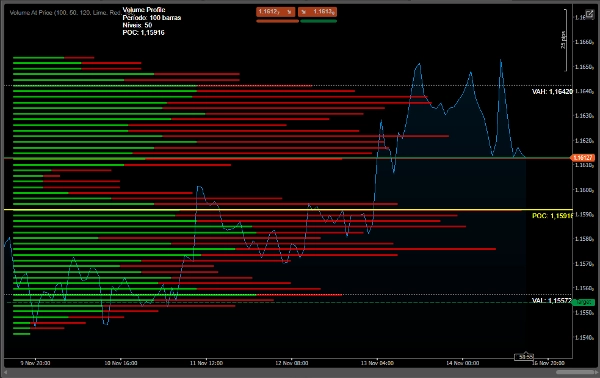
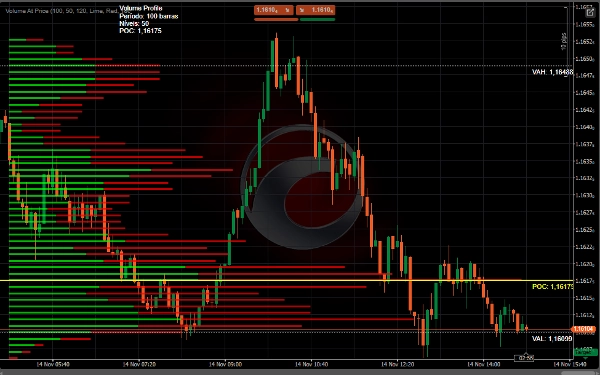
1. POC (Точка контроля)
Linha Amarela - Цена с наибольшим объемом торгов
Область наибольшей ликвидности и цены
Естественная поддержка/сопротивление
2. Зона стоимости
Белые линии - Область, где было совершено 70% объема торгов
VAH (Value Area High) - Верхний предел
VAL (Value Area Low) - Нижний предел
Зона баланса рынка
3. Ядра объема
🟢 Зеленый - Доминирующий объем покупок
🔴 Vermelho - Доминирующий объем продаж
Длина бара = Интенсивность объема
📊 Используйте стратегии
1. Идентификация поддержек и сопротивлений
• POC функционирует как динамическая поддержка/сопротивление
• Зона стоимости определяет зону баланса
• Важные края профиля S/R
2. Анализ пробоя
• Пробой выше VAH → Восходящий тренд
• Пробой ниже VAL → Нисходящий тренд
• Отсутствие пробоя объема подтверждает движение
3. Точки входа
• Покупка: Повторное тестирование VAL с объемом покупателей
• Продажа: Повторное тестирование VAH с объемом продавцов
• Фейд: Торговля против экстремумов профиля
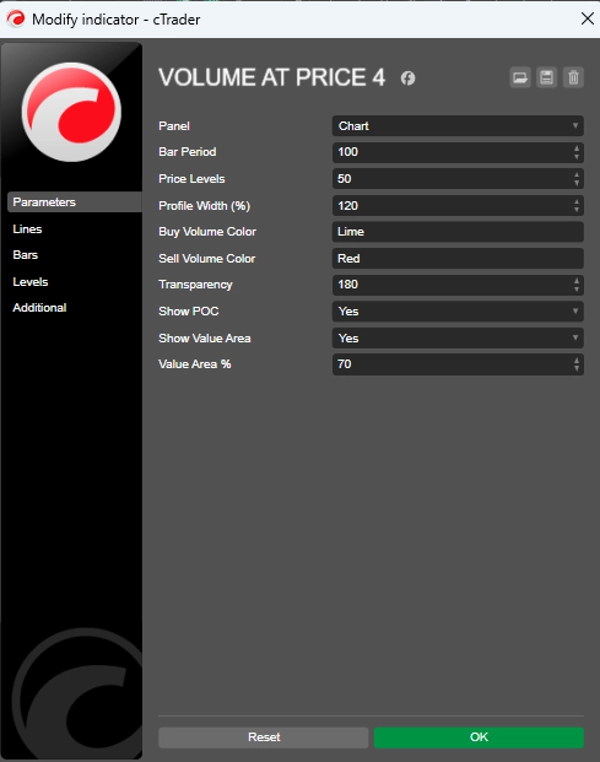
⚙️ Рекомендуемые настройки
Для дневной торговли
csharp
Период = 50-100
Уровни цены = 50
Ширина профиля = 120%
Процент зоны стоимости = 70
Для свинг-трейдинга
csharp
Период = 100-200
Уровни цены = 80
Ширина профиля = 150%
Процент зоны стоимости = 70
✅ ПРЕИМУЩЕСТВА:
Определяет динамические поддержки/сопротивления
Показывает намерения рынка (объем)
Выявляет важные зоны ликвидности
Четкая визуализация дисбалансов
Подсчет текущих тиков объема
Сводка
- Point of Control (POC): The price level with the highest traded volume, acting as a dynamic support or resistance.
- Value Area: The price range where 70% of volume is traded, defined by Value Area High (VAH) and Value Area Low (VAL), representing market balance zones.
- Volume Cores: Colored bars indicating dominant buying (green) or selling (red) volume, with bar length reflecting volume intensity.
The indicator supports strategies like identifying support and resistance levels, breakout analysis (trend direction based on VAH and VAL breaks), and entry points (buy near VAL with buyer volume, sell near VAH with seller volume, or fade at profile extremes).
Recommended settings vary by trading style: for day trading, shorter periods and narrower profiles; for swing trading, longer periods and wider profiles. This tool aids in visualizing liquidity, market intent, and volume imbalances to inform trading decisions.
Отзывы покупателей
5 | 0 % | |
4 | 50 % | |
3 | 50 % | |
2 | 0 % | |
1 | 0 % |


