
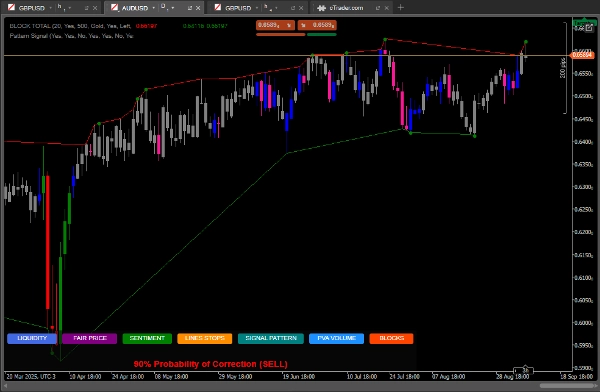
説明
MAGIC BLOCK STRATEGYインジケーターは、市場分析の2つの主要なアプローチを組み合わせています:
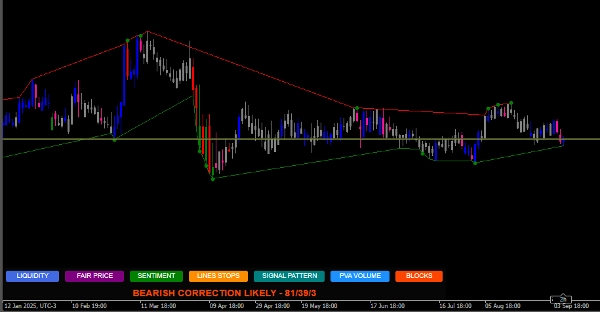
オーダーブロック検出:
過去の期間内の破られていない高値と安値に基づいてサポートとレジスタンスのエリアを特定します。
価格が破られていない安値を上回って終値をつけたときに買いシグナルを生成します。
価格が破られていない高値を下回って終値をつけたときに売りシグナルを生成します。
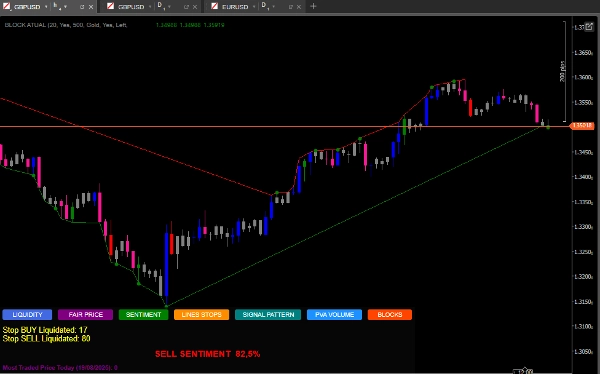
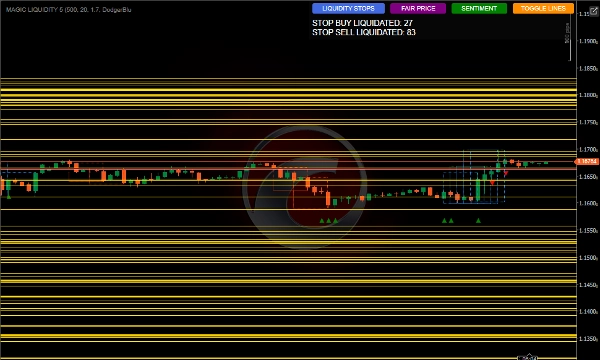
流動性分析:
ストップロスが集中している可能性のある流動性プールのエリアを検出します。
買いおよび売りのストップの発動を監視します。
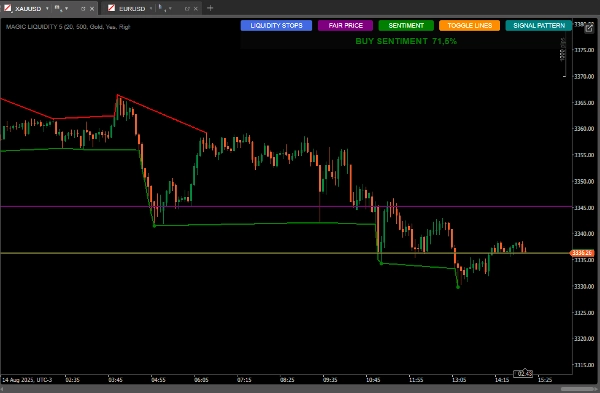
流動性の分布に基づいて市場センチメントを計算します。
最も取引された公正価格を特定します。
最良の結果を得るための使い方
初期設定
ルックバック期間:取引している時間枠に応じてルックバック期間のパラメーターを調整してください。高い時間枠にはより高い値を設定します。
分析に使用するローソク足の数:堅牢な分析には500のままにするか、より速い反応を望む場合は減らしてください。
流動性プールの色:チャート上で目立つ色を選択してください。
シグナルの解釈
オーダーブロックシグナル:
緑の点:価格が破られていない安値を上回って終値をつけたときの買いシグナル。
赤の点:価格が破られていない高値を下回って終値をつけたときの売りシグナル。
流動性プール:
水平線は流動性のあるエリア、潜在的なターゲットまたは反転ポイントを示します。
現在の価格の上/下の流動性の関係を監視してください。
市場センチメント:
SENTIMENTボタンを使って、支配的な方向性と信頼度を確認してください。
高い信頼度の買いセンチメントは継続的な成長を示唆し、高い信頼度の売りセンチメントは弱気の継続を示唆します。
ローソク足パターン:
SIGNAL PATTERNボタンは分析し、
定量的比率に基づく修正の確率を表示します
最も取引された公正価格:
PRICEボタンは、その日の最も取引量の多い価格レベルを示します。
価格の磁石として、またはサポート/レジスタンスとして機能することがあります。
使用戦略
保守的戦略:
オーダーブロックシグナルが支配的なセンチメントと一致するときのみ取引します。
流動性プールを利益確定のターゲットとして使用します。
積極的戦略:
価格が多くのストップが蓄積された流動性プールに近づくと反転を予測します。
センチメントと価格アクションの乖離を使って逆トレンド取引を行います。
追加の確認:
インジケーターが示すローソク足パターンと比較してください。
公正価格が近くにあるかどうかを関心エリアとして確認してください。
リスク管理。
ストップロス:
買いの場合は最新のオーダーブロックの下に配置します
売りの場合は最新のオーダーブロックの上に配置します
利益確定:
近くの流動性プールをターゲットにします
ターゲット設定には上/下の流動性比率を考慮してください
高度なヒント
チャートが混雑したときはTOGGLE LINESボタンで流動性ラインを無効にしてください
動きの強さを評価するために清算されたストップの数を監視してください
公正価格は、動的なサポート/レジスタンスのようなレンジ相場で特に有用です
確認のために他のインジケーター(ボリューム、移動平均など)と組み合わせてください
SIGNAL PATTERNはD1タイムフレームで利用可能です。
https://ctrader.com/pt/products/1725?u=Goulart
https://ctrader.com/pt/products/1386?u=Goulart
概要
The indicator also analyzes liquidity pools, highlighting areas where stop losses may accumulate and monitoring the activation of buy and sell stops. It calculates market sentiment based on liquidity distribution and identifies the most traded price level of the day, which can act as dynamic support or resistance.
Users can customize parameters such as lookback period and number of candles for analysis to suit different timeframes and trading styles. Visual signals include green and red dots for buy and sell order block signals, horizontal lines for liquidity pools, and sentiment indicators showing prevailing market direction and confidence.
The tool supports conservative strategies that align order block signals with sentiment and use liquidity pools as profit targets, as well as aggressive strategies that anticipate reversals near liquidity pools and exploit divergences between sentiment and price action. Additional features include candlestick pattern correction probabilities and options to toggle liquidity lines for chart clarity. Risk management guidance suggests placing stop-loss orders relative to recent order blocks and setting take-profit targets near liquidity pools.


