
HorizontalSupportResistance
インジケーター
778 ダウンロード数
バージョン 1.0、Apr 2025
Windows、Mac
4.5
レビュー: 2
説明
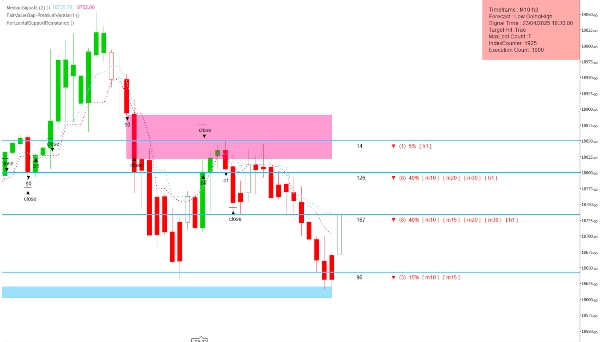
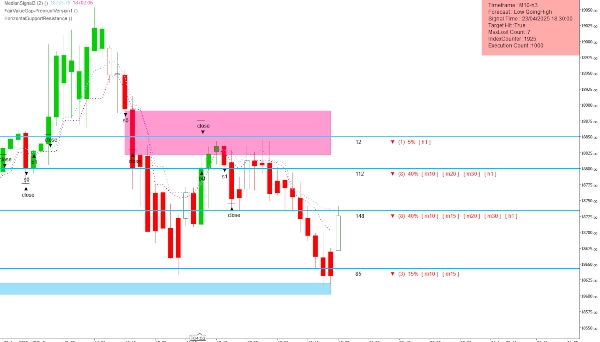
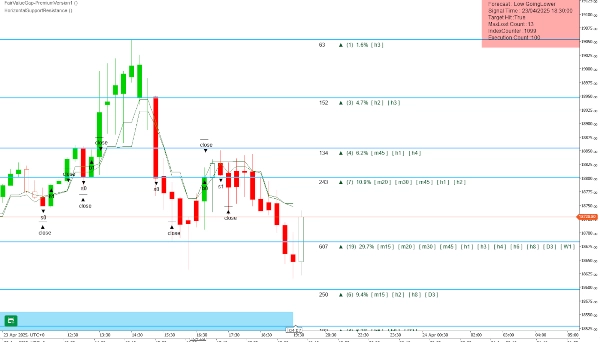
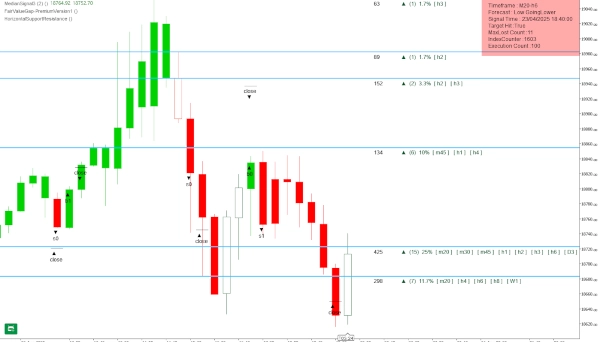
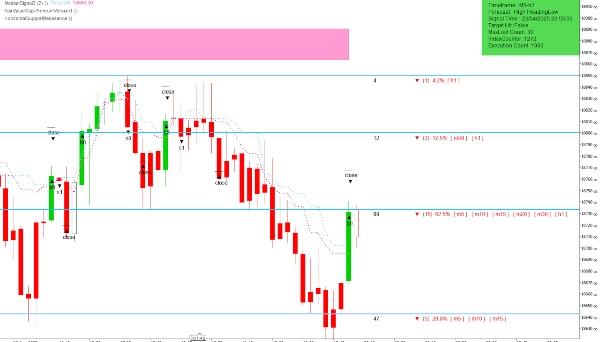
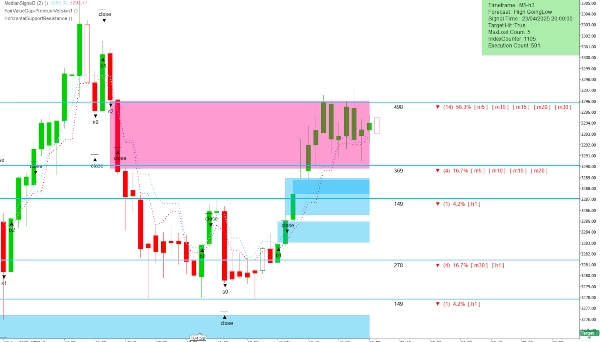
この並外れたマルチタイムフレームのサポート&レジスタンス指標は、市場の魔法のようなものです。精密に設計され、スマートなロジックに裏打ちされており、すべての外国為替、指数、株式、特にNASDAQ100の重要な価格レベルを驚異的な精度で特定します。熟練トレーダーの直感が視覚ツールに組み込まれたかのように、価格が反応し、反転し、加速する主要なゾーンを強調表示し、ほとんど超自然的に感じられる優位性を提供します。クリーンなローソク足の表現と鮮やかで明確にマークされたレベルにより、この指標は単に市場を追うだけでなく、市場を予測します。短期のスキャルピングでも長期のポジション保持でも、このツールはあなたの個人的な取引の神託のように機能し、より賢明で自信に満ちた決定へと静かに導きます。
概要
AIによる概要
HorizontalSupportResistance is a multi-timeframe indicator designed to identify critical horizontal support and resistance levels across various markets including forex, indices, and stocks, with particular accuracy on the NASDAQ100. It visually highlights key price zones where the market tends to react, reverse, or accelerate, using clear candlestick representations and distinct level markings. The indicator supports trading strategies ranging from short-term scalping to longer-term position holding by providing anticipatory signals of potential price movements. It is suitable for use on multiple asset classes such as forex pairs (e.g., GBPUSD), stock indices, and equities, helping traders recognize important price levels to inform their decisions.
インジケーターのプロフィール
カスタマーレビュー
4.5
レビュー: 2
5 | 50 % | |
4 | 50 % | |
3 | 0 % | |
2 | 0 % | |
1 | 0 % |
カスタマーレビュー
August 12, 2025
Pros: Accurate auto SR levels, customizable appearance, lightweight. Cons: No level strength filter, no alerts, possible chart clutter.
June 20, 2025
The Indicator is excellent, What's the core logic of this Indicator, Kindly share if you don't mind.
ディスカッション
よくあるご質問
Forex
Scalping
Indices
GBPUSD
Stocks
cTrader Storeで入手可能な取引ボット、インジケーター、プラグインなどの商品は、第三者の開発者が提供するものであり、情報と技術の取得のみを目的としてご利用いただけます。cTrader Storeはブローカーではなく、投資助言や個人的な推奨を行うことも、将来のパフォーマンスを保証することもありません。


これも好きかも


価格
登録日 19/04/2025
284.21M
取引数量
1.08M
獲得pips
8
販売
3.46K
無料インストール