
Levels
インジケーター
175 ダウンロード数
バージョン 1.0、Jan 2026
Windows、Mac
説明
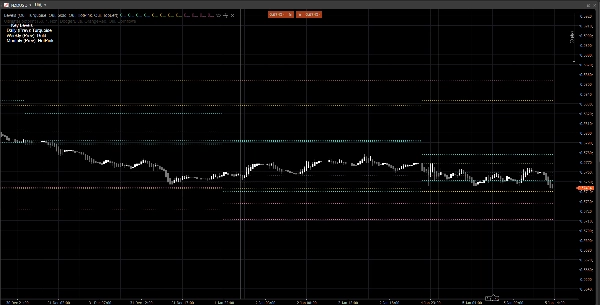
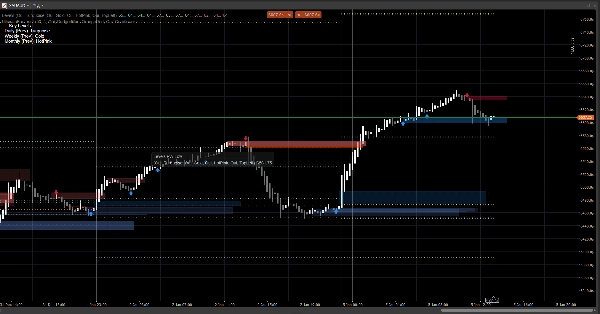
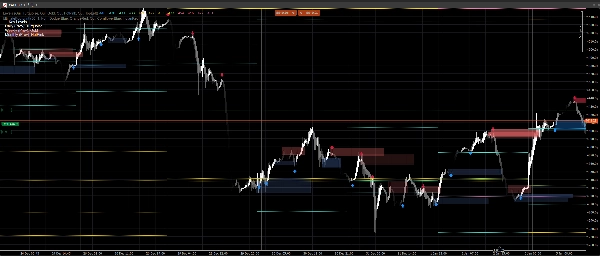
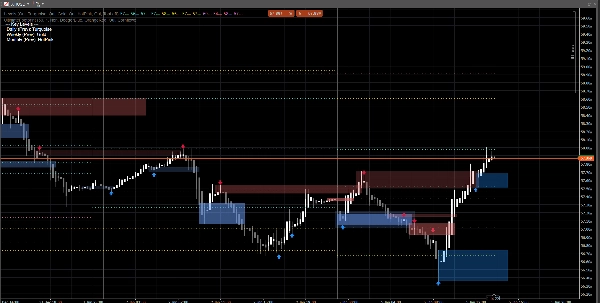
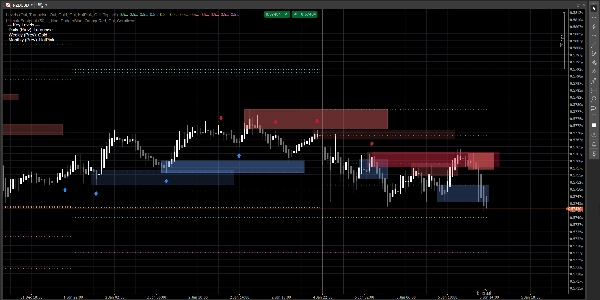
Price Action Zones は、チャート上に 前回の日次、週次、月次 の重要なレベルを直接プロットする、軽量でノイズのないインジケーターです。
以下を表示します:
- 前日:高値 / 安値 / 始値 / 終値
- 前週:高値 / 安値 / 始値 / 終値
- 前月:高値 / 安値 / 始値 / 終値
これらのレベルは、反応ゾーン、流動性の参照点、および コンテキストの基準点として、市場構造、エントリー、ターゲット、リスク配置に広く利用されています。
なぜ役立つのか
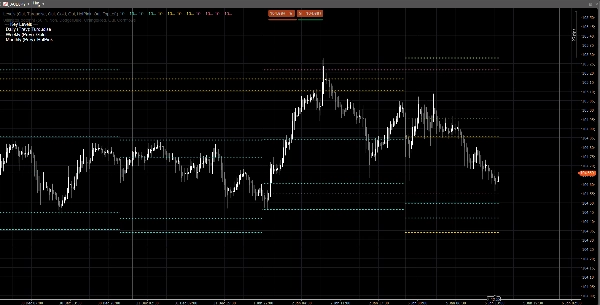
- チャートを切り替えずに上位時間軸の参照レベルを即座に確認できる
- PDH/PDL、PWH/PWL、PMH/PMLを中心に日中の価格動向を把握するのに役立つ
- 視覚的にすっきり:現在のセッション/週/月の間、レベルは一定に保たれる
- どのシンボルや時間軸でも機能する
カスタマイズ
各時間軸を独立して切り替えることができます:
- 日次 / 週次 / 月次の表示切替
- 各グループに対してカスタムの 色 を設定可能
- 選択可能なコーナー位置でシンプルな 凡例 を有効化
技術的な注意点
- レベルは 前回完了した 日次/週次/月次のローソク足(現在形成中のものではない)を使用して計算されます。
- これにより再描画を防ぎ、セッション中レベルを安定させます。
免責事項
このインジケーターはチャート表示および意思決定支援のために提供されています。売買シグナルを生成せず、金融アドバイスではありません。常にリスク管理を行い、ご自身のデータで検証してください。
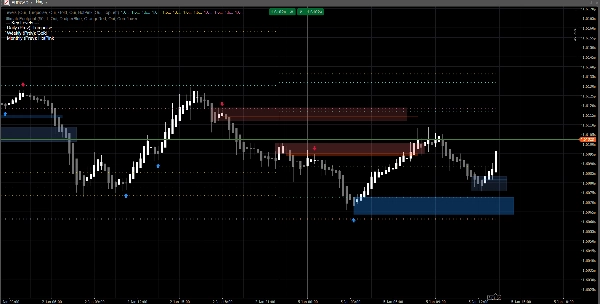
チャート上のシグナルは、私のプロフィールで利用可能なインジケーター Ultimate Footprint によって生成されています。
概要
インジケーターのプロフィール
カスタマーレビュー
0.0
レビュー: 0
カスタマーレビュー
この商品にはまだレビューがありません。お使いになったことがある方は、ぜひレビューをお願いします。
ディスカッション
よくあるご質問
Prop
Forex
Indices
Commodities
Crypto
Stocks
cTrader Storeで入手可能な取引ボット、インジケーター、プラグインなどの商品は、第三者の開発者が提供するものであり、情報と技術の取得のみを目的としてご利用いただけます。cTrader Storeはブローカーではなく、投資助言や個人的な推奨を行うことも、将来のパフォーマンスを保証することもありません。


価格
登録日 23/07/2025
6.91M
取引数量
27.63K
獲得pips
877
無料インストール