
VSA
インジケーター
271 ダウンロード数
バージョン 1.0、Nov 2025
Windows、Mac
5.0
レビュー: 1
説明
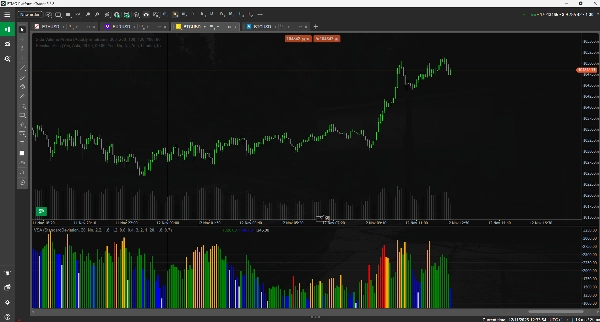
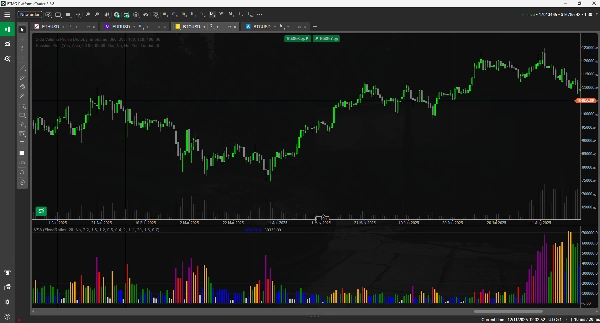
3つの異なる分析モードを備えた高度なマルチモードの出来高インジケーターです。取引スタイルに合わせて瞬時に切り替えられます。
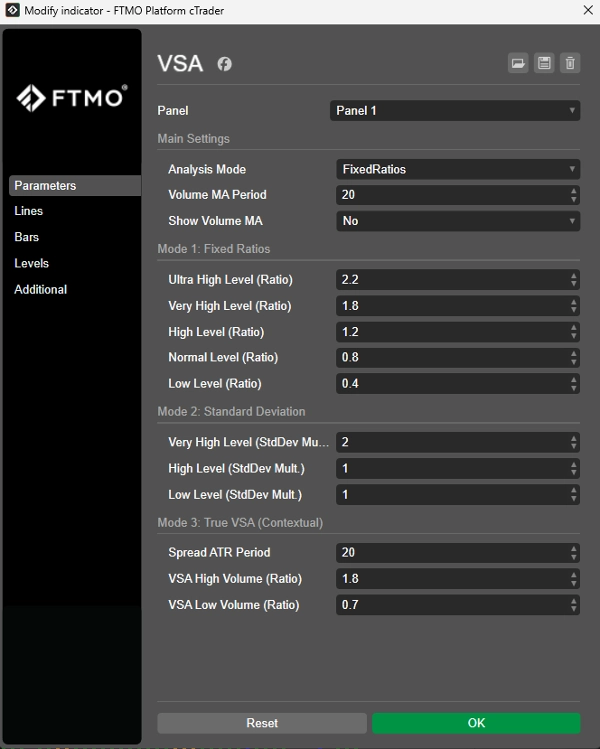
モード1:固定比率
出来高を移動平均にユーザー定義の固定比率(例:「高値」の場合は2.0倍)を掛けた値と比較して分類します。
最適な用途:手動制御と固定閾値を好むトレーダー向け。
モード2:標準偏差(適応型)
このモードは市場の変動性に自動的に適応します。出来高が平均(移動平均)からどれだけ標準偏差離れているかに基づいて分類します。
最適な用途:あらゆる銘柄や時間枠で「すぐに使える」適応型ツール。
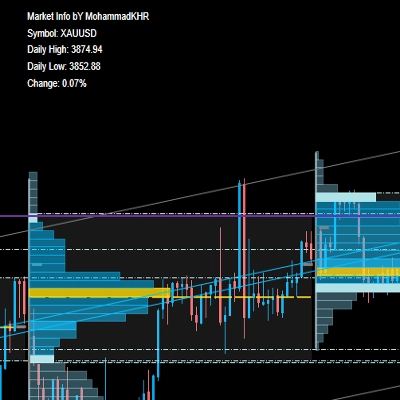
モード3:True VSA(コンテキスト型)
クラシックでプロフェッショナルなアプローチ。このモードは出来高+スプレッド(レンジ)+終値の位置を組み合わせてバーのコンテキストを分析し、重要なシグナルを特定します。
概要
AIによる概要
The VSA indicator is an advanced volume analysis tool offering three distinct modes to suit different trading approaches.
1. Fixed Ratios mode categorizes volume by comparing it to a moving average multiplied by user-defined fixed ratios, providing manual control over volume thresholds.
2. Standard Deviation mode adapts automatically to market volatility by classifying volume based on its deviation from the moving average, suitable for use across various instruments and timeframes without manual adjustment.
3. True VSA (Contextual) mode applies a professional volume spread analysis by evaluating volume in conjunction with bar range and close position to identify key market signals.
This multi-mode indicator supports a wide range of markets including Forex, cryptocurrencies (e.g., BTCUSD, ETH), commodities (e.g., gold, oil), indices (e.g., NAS100, SP500), and stocks. It enables traders to switch instantly between modes to align with their preferred analysis style and trading strategy.
インジケーターのプロフィール
カスタマーレビュー
5.0
レビュー: 1
5 | 100 % | |
4 | 0 % | |
3 | 0 % | |
2 | 0 % | |
1 | 0 % |
ディスカッション
よくあるご質問
BTCUSD
Forex
Signal
Indices
EURUSD
Commodities
GBPUSD
NZDUSD
Prop
Crypto
Stocks
XAUUSD
NAS100
ATR
USDJPY
cTrader Storeで入手可能な取引ボット、インジケーター、プラグインなどの商品は、第三者の開発者が提供するものであり、情報と技術の取得のみを目的としてご利用いただけます。cTrader Storeはブローカーではなく、投資助言や個人的な推奨を行うことも、将来のパフォーマンスを保証することもありません。
この作成者の他の商品


これも好きかも


価格
登録日 26/05/2025
396.22M
取引数量
60.88K
獲得pips
15
販売
1.42K
無料インストール