
Candle Volume Profile Demo
インジケーター
465 ダウンロード数
バージョン 1.0、Nov 2025
Windows、Mac
4.0
レビュー: 1
説明
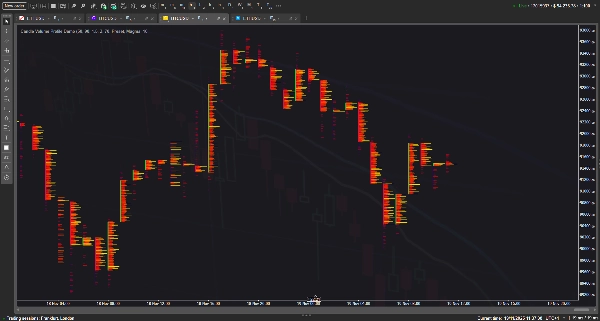
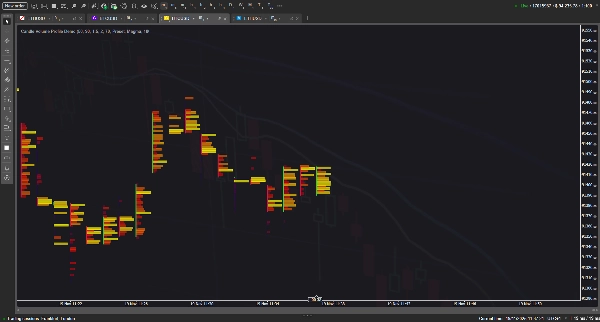
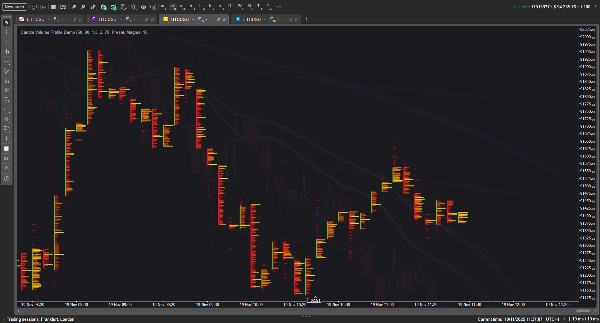
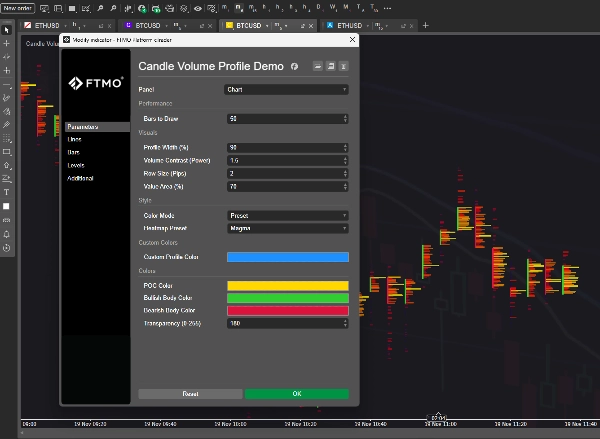
このインジケーターは、個々のバーのボリュームプロファイルを視覚化し、標準的なローソク足を詳細な「フットプリント」スタイルのチャートに変換します。カスタマイズ可能なヒートマップ、ポイント・オブ・コントロール(POC)ライン、およびバリューエリアブロックを使用して、価格レベルごとの出来高分布を強調表示します。これは、ヒューリスティックな出来高分布を用いて市場の活動をチャート上に直接描画することで、プロフェッショナルなオーダーフローツールを模倣することを目的としています。
理論的には、このコンセプトは深い市場洞察をシームレスに提供するはずですが、実際には描画に必要な膨大な数のグラフィカルオブジェクトのため、このインジケーターに多くの機能や履歴の深さを要求すればするほど、遅延やターミナルの不安定さを引き起こしやすくなります。 :(
概要
AIによる概要
Candle Volume Profile Demo is an indicator designed for cryptocurrency markets, specifically visualizing volume distribution within individual candlestick bars. It transforms standard candlesticks into detailed footprint-style charts by applying heuristic volume profiling techniques. Key features include customizable heatmaps, Point of Control (POC) lines, and Value Area blocks, which highlight volume concentration at specific price levels. This approach aims to replicate professional order flow analysis by rendering market activity directly on the price chart, providing granular insights into volume dynamics per bar. The indicator supports BTCUSD and other crypto symbols, integrating concepts such as Fair Value Gap (FVG), ZigZag patterns, ATR, and VWAP for enhanced volume and volatility context. Users can adjust visualization parameters to explore volume profiles over different historical depths, though extensive feature use may impact performance due to graphical complexity. This tool is intended for traders seeking detailed volume-based market structure analysis within crypto trading environments.
インジケーターのプロフィール
カスタマーレビュー
4.0
レビュー: 1
5 | 0 % | |
4 | 100 % | |
3 | 0 % | |
2 | 0 % | |
1 | 0 % |
カスタマーレビュー
November 24, 2025
Candle Volume Profile Demo gives you a clean visual of volume distribution inside candles/ranges - a smart add-on for liquidity-aware traders. The visualization is sharp and performance solid, but as a demo version it lacks full features (history logs, advanced filters). Best when paired with structure and confirmation tools. A good starting point, ready to level up.
ディスカッション
よくあるご質問
BTCUSD
Signal
ZigZag
Fair Value Gap
Crypto
ATR
VWAP
cTrader Storeで入手可能な取引ボット、インジケーター、プラグインなどの商品は、第三者の開発者が提供するものであり、情報と技術の取得のみを目的としてご利用いただけます。cTrader Storeはブローカーではなく、投資助言や個人的な推奨を行うことも、将来のパフォーマンスを保証することもありません。


これも好きかも


価格
登録日 26/05/2025
388.58M
取引数量
60.75K
獲得pips
15
販売
1.41K
無料インストール