
TrendStrengthSignals
インジケーター
バージョン 1.0、Aug 2025
Windows、Mac
5.0
レビュー: 1
説明
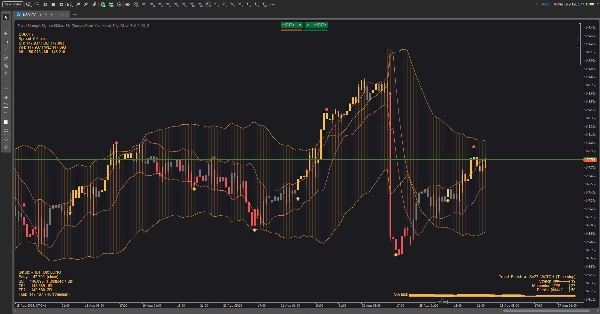
ボラティリティエンベロープとサイクル認識チャネルを組み合わせて、レジーム、タイミング、リスクを一目で示すトレンドトレーディングのためのビジュアルツールキットです。どんな背景(明るい/暗い)でも読みやすく、画面をすっきり保ちながら「次に何をすべきか」のヒントを提供するよう設計されています。
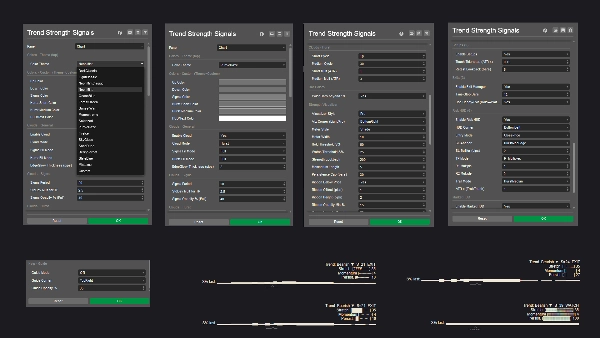
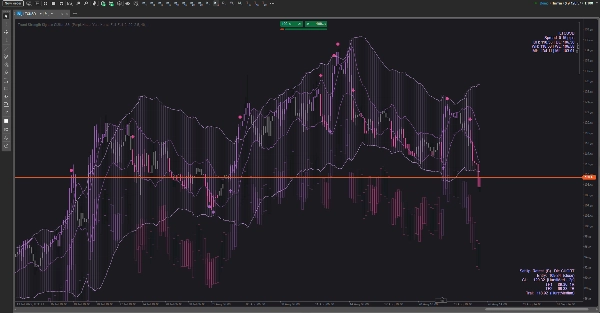
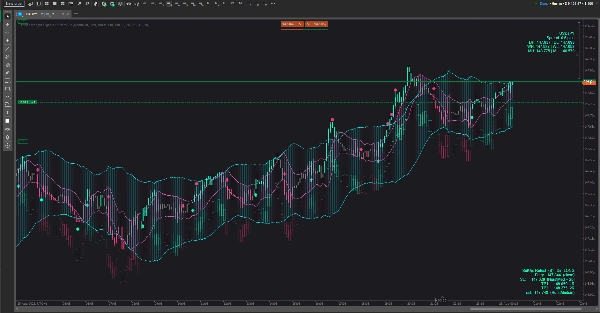
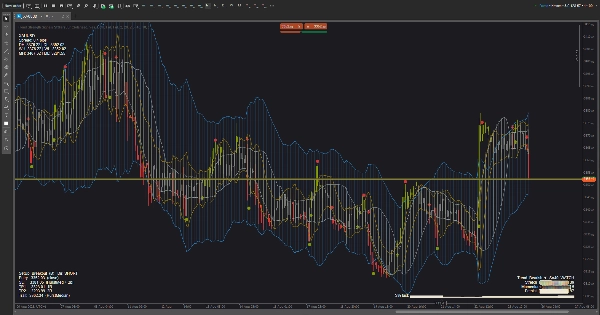
チャートに表示されるもの
- クラウド(切り替え可能):
-
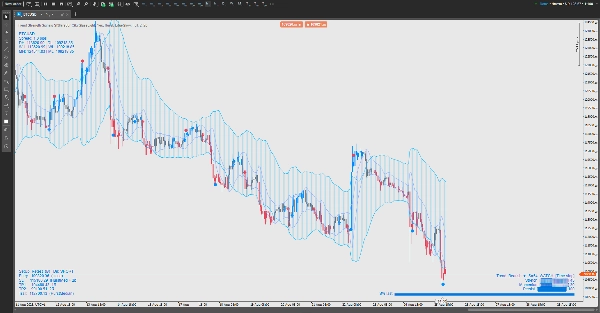
- 市場の活動に応じて拡大・収縮するボラティリティクラウド。
- 価格の周期的リズムを追跡するサイクルクラウド。
- どちらか一方、両方、または表示しないことも可能です。
- シグナル:潜在的なトレンド変化を示す控えめな上下矢印;利益確定の小さな点。
- トレンド強度HUD(3スタイル):
-
- ライト — コンパクトなステータスタグ。
- プロ — 3つのメーター(ストレッチ、モメンタム、パーシステンス)とミニ履歴スパークラインを備えた小さなダッシュボード。
- リボン — 価格近くの柔らかいバーで、その強度はトレンド強度に従います。
- リスクHUD:方向性、保護的なストップエリア、2層の利益目標、オプションのトレーリングアイデアを提案します。選択した任意のコーナーに配置され、バーの進行に応じて更新されます。
- マーケットHUD:シンボル&スプレッド、日/週/月の高値・安値の参照を表示し、常に大きな地図内の現在位置を把握できます。
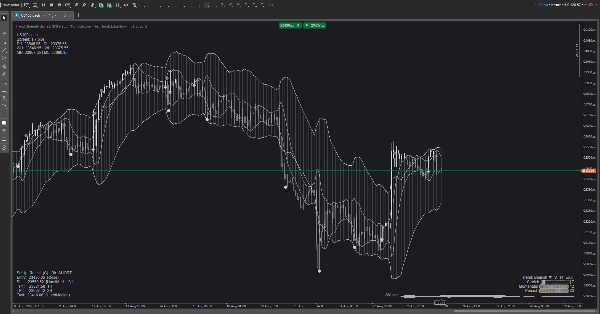
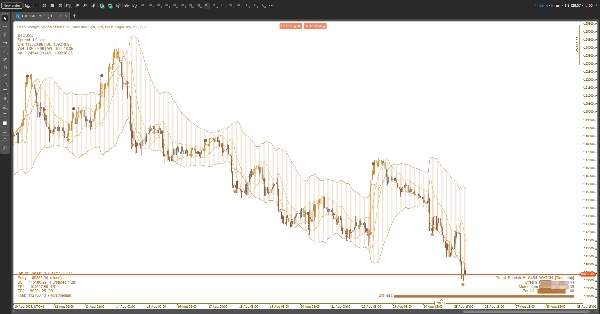
- テーマ:ライトとダークチャート用にキュレーションされたカラースキーム(およびカスタムモード)。すべてのグラフィック要素—HUDやシグナルも含む—はアクティブなテーマに従います。
使い方(実用的で技術的ではない)
- クラウドビューを選ぶ:
-
- 圧縮と拡大を見るためにボラティリティクラウドを使います。
- 「エッジ」と「ミドル」の回転を判断するためにサイクルクラウドを使います。
- コンテキストとタイミングの両方が欲しい場合は両方を使います。
- トレンド強度を読む:
-
- ステータスがHOLDに上がったら、現在の方向にバイアスをかけて取引します。ステータスがWATCHに下がったら、攻撃性を減らします。ステータスがEXITを示したら、新規取引を避けるかリスクを引き締めます。
- プロモードでは、メーターとスパークラインが上昇していると品質が向上し、メーターが減少しているとリスクを管理します。
- 価格とクラウドの関係でエントリーのタイミングを計る:
-
- 圧縮後のブレイクアウト、クラウドへの穏やかなプルバック後の再エントリー、または外縁からの反発が基本的なパターンです。
- バーの途中で早期の矢印が現れて消えた場合、フェイクを減らしたいならバーのクローズ確認を待ちます。
- リスクHUDで取引を管理する:
-
- HUDが強調する最も近い構造的境界の少し先に保護的なストップを置きます。
- TP1で一部利確し、残りはTP2を目指すか提案されたトレーリングラインに従います。
- トレンド強度が強から弱に衰えた場合は、早めの決済を検討します。
- 状況に応じたフィルター:
-
- クラウドが薄く不安定な時や、強度ステータスがEXITにある時はエントリーを避けます。
- 強度が高まり、クラウドが傾き、価格がエッジときれいに相互作用している時は取引を優先します。
カスタマイズ
- HUDのコーナー、表示スタイル、カラーテーマを作業環境に合わせて切り替えます。
- ライトフレンドリーなテーマは白背景でもテキストを見やすくし、オーシャン/フォレスト/サンセットのパレットはまぶしさなく微妙なコントラストを加えます。
これは違います
これはブラックボックスの自動売買システムではありません。意思決定支援ツールであり、トレンドの質をフレーム化し、合理的なリスク位置を提案し、高確率の瞬間を強調しますが、操作はあなたがコントロールします。
概要
インジケーターのプロフィール
カスタマーレビュー
5.0
レビュー: 1
5 | 100 % | |
4 | 0 % | |
3 | 0 % | |
2 | 0 % | |
1 | 0 % |
カスタマーレビュー
September 2, 2025
The reason it feels usable is direction is easier to respect, and a 1R exit plan makes review easier.
ディスカッション
よくあるご質問
cTrader Storeで入手可能な取引ボット、インジケーター、プラグインなどの商品は、第三者の開発者が提供するものであり、情報と技術の取得のみを目的としてご利用いただけます。cTrader Storeはブローカーではなく、投資助言や個人的な推奨を行うことも、将来のパフォーマンスを保証することもありません。


![「[Stellar Strategies] Inside Bar with Signals」ロゴ](https://cdn.ctrader.com/image/webp/1d9e8bfa-3b2c-4440-bb37-5856902008a7_30683)

価格
登録日 26/05/2025
385.09M
取引数量
60.66K
獲得pips
14
販売
1.4K
無料インストール