
説明
cTrader用FZインジケーター
説明
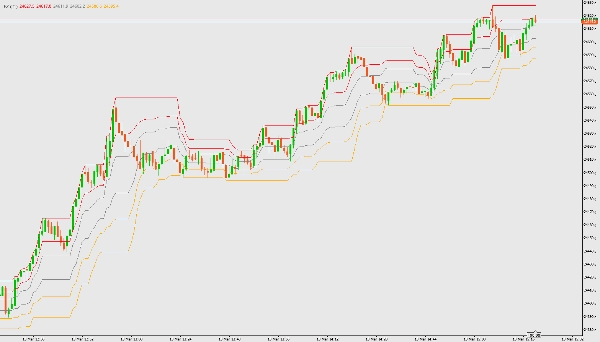
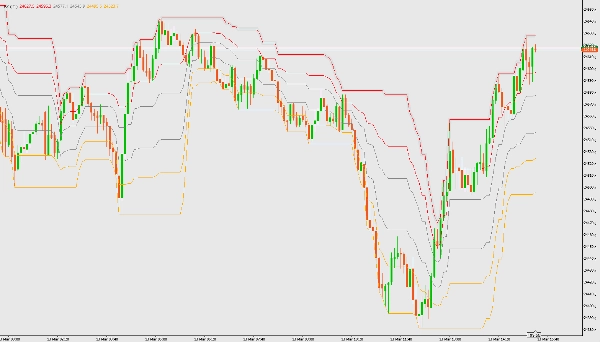
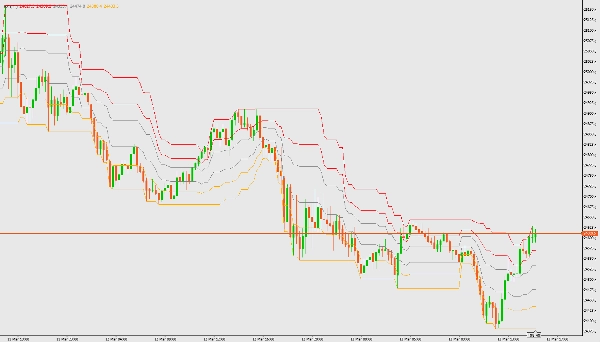
FZインジケーターは、ユーザー定義期間の最高値と最安値に基づいてフィボナッチチャネルゾーンを描画します。トレンドゾーンや潜在的な反転エリアの特定に役立ちます。
特徴
パラメーター
- 直近##本のバーで計算:計算に使用するバーの数(デフォルト:21)
使い方
- FZインジケーターのファイル(FZ.cs)をダウンロードしてcTraderプラットフォームに追加します。
- cTrader Automateでインジケーターをコンパイルします。
- 任意のチャートにインジケーターを適用します。
- 必要に応じてバーの数のパラメーターを調整します。
- 色分けされたゾーンを解釈します:
-
- シアン:上昇トレンドゾーン(ロング)
- グレー:レンジゾーン(トレンド変化を待つ)
- オレンジ:下降トレンドゾーン(ショート)
概要
インジケーターのプロフィール
カスタマーレビュー
4.0
レビュー: 2
5 | 0 % | |
4 | 100 % | |
3 | 0 % | |
2 | 0 % | |
1 | 0 % |
ディスカッション
よくあるご質問
BTCUSD
Forex
Signal
Breakout
Indices
EURUSD
Commodities
GBPUSD
NZDUSD
Prop
Scalping
Crypto
Grid
Stocks
AI
XAUUSD
NAS100
USDJPY
cTrader Storeで入手可能な取引ボット、インジケーター、プラグインなどの商品は、第三者の開発者が提供するものであり、情報と技術の取得のみを目的としてご利用いただけます。cTrader Storeはブローカーではなく、投資助言や個人的な推奨を行うことも、将来のパフォーマンスを保証することもありません。
この作成者の他の商品


価格
登録日 10/03/2026
105
無料インストール