
説明
Sero — モメンタムオシレーター
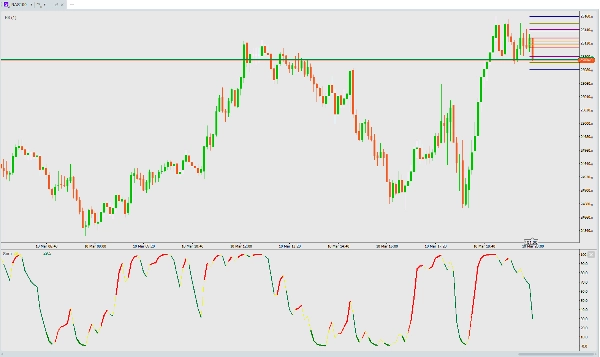
Seroは確率論に基づくモメンタムオシレーターで、市場のモメンタム変化を明確に色分けされた視覚的信号で示します。
仕組み
Seroは、15バーの範囲で典型価格(高値+安値+終値)÷3から平滑化された確率論的値を計算し、その後高速の2期間EMAを適用して応答性の高い0〜100のオシレーターを生成します。
注目ポイント
色が示す意味:
- 黄色の線 — 基本のSero値(常に表示)
- 赤い線 — 強気のモメンタム(Seroが上昇中)
- 太い赤い線 — 強い強気モメンタム(上昇中+20以上 — 売られ過ぎからのブレイクアウトを確認)
- 緑の線 — 弱気のモメンタム(Seroが下降中)
- 太い緑の線 — 強い弱気の急落(下降中+20以下 — 売られ過ぎ領域の深部)
重要なシグナル:
- 買いシグナル — 色が緑から赤に変わる、特に20以下から(売られ過ぎの反転)
- 売りシグナル — 色が赤から緑に変わる、特に80以上から(買われ過ぎの反転)
- 強いトレンド — 太い線がモメンタムの確信を示す
- 疲労感 — 20以下の太い緑線=売り手の勢いが弱まっている可能性、反転に注意
ベストプラクティス
- どのタイムフレームでも、かつどの銘柄
- 価格の動きやサポート/レジスタンスレベルと組み合わせて確認する
- 極端な値(0または100)付近での色の変化が最も確度の高いシグナル
- 設定不要 — 最適化済みで箱から出してすぐに使える
概要
AIによる概要
Sero is a stochastic-based momentum oscillator designed to identify market momentum shifts through clear, color-coded visual signals. It calculates a smoothed stochastic value from the Typical Price [(High + Low + Close) / 3] over a 15-bar range, then applies a fast 2-period exponential moving average (EMA) to generate a responsive oscillator ranging from 0 to 100.
The indicator displays multiple colored lines to represent momentum states:
- Yellow line: base Sero value (always visible)
- Red line: bullish momentum (rising oscillator)
- Thick red line: strong bullish momentum (rising and above 20, indicating breakout from oversold)
- Green line: bearish momentum (falling oscillator)
- Thick green line: strong bearish momentum (falling and below 20, indicating deep oversold conditions)
Key signals include buy signals when the color flips from green to red, especially below 20 (oversold reversal), and sell signals when it flips from red to green, especially above 80 (overbought reversal). Thick lines confirm strong momentum trends, while thick green lines below 20 may indicate exhaustion of selling pressure and potential reversal.
Sero works on any timeframe and instrument without requiring user settings, and it is recommended to combine it with price action or support/resistance levels for confirmation. Color transitions near extremes (0 or 100) provide the highest-probability signals.
インジケーターのプロフィール
カスタマーレビュー
0.0
レビュー: 0
カスタマーレビュー
この商品にはまだレビューがありません。お使いになったことがある方は、ぜひレビューをお願いします。
ディスカッション
よくあるご質問
BTCUSD
Forex
Signal
Indices
EURUSD
Commodities
GBPUSD
NZDUSD
Crypto
Stocks
XAUUSD
NAS100
USDJPY
cTrader Storeで入手可能な取引ボット、インジケーター、プラグインなどの商品は、第三者の開発者が提供するものであり、情報と技術の取得のみを目的としてご利用いただけます。cTrader Storeはブローカーではなく、投資助言や個人的な推奨を行うことも、将来のパフォーマンスを保証することもありません。
この作成者の他の商品


![「Gaussian Channel [Iridio Capital]」ロゴ](https://cdn.ctrader.com/image/webp/7c039209-5573-4a54-a072-f9528b503103_41960)

価格
登録日 10/03/2026
104
無料インストール