
説明
📌 機能と特徴
- ボリンジャーバンド(20期間の単純移動平均と標準偏差2)
-
- 上部バンド: 過買い水準を示します。
- 下部バンド: 過売り水準を示します。
- 相対力指数(RSI)(14期間)
-
- RSI 70以上 → 市場は 過買い(過剰な買い圧力)。
- RSI 30以下 → 市場は 過売り(過剰な売り圧力)。
- 反転ゾーンを検出:
-
- レッドゾーン(過売り):
-
- 終値が下部ボリンジャーバンドを下回る。
- RSIが30以下(強い売り圧力)。
- 意味: 市場は過売り状態で、買いのチャンスの可能性があります。
- グリーンゾーン(過買い):
-
- 終値が上部ボリンジャーバンドを上回る。
- RSIが70以上(強い買い圧力)。
- 意味: 市場は過買い状態で、売りのチャンスの可能性があります。
- 視覚的チャートマーカー:
-
- 赤色のシェードゾーンは過売り時(買いのチャンスの可能性)。
- 緑色のシェードゾーンは過買い時(売りのチャンスの可能性)。
- アラートとサウンドシグナル:
-
- チャート上にテキストが表示されます(「深い過売りシグナル!」または「深い過買いシグナル!」)。
- 過買い/過売り状態が検出されるとサウンド通知が鳴ります。
🎯 このインジケーターはトレーダーにどのように役立つのか?
✅ 潜在的な市場反転の警告シグナルを提供します(極端な価格レベルで)。
✅ トレーダーが強力なエントリーとエグジットポイントを見つけるのを助けます。
✅ ボリンジャーバンドとRSIを組み合わせて、信頼性の高い過買い/過売り検出を実現します。
✅ デイトレード、スイングトレード、スキャルピングに適しており、異なる時間軸で使用可能です。
🚀 まとめ:
このインジケーターは過買いおよび過売り状態を識別し、価格反転の可能性があるときに警告します。トレーダーはこれを利用して、賢明な売買判断を下すことができます!
🚨 取引リスク免責事項 🚨
株式、外国為替、暗号通貨、商品、デリバティブを含む金融商品取引は高いリスクを伴い、すべての投資家に適しているわけではありません。取引を行う前に、リスクを理解し、財務状況、経験、リスク許容度を慎重に考慮することが不可欠です。
市場は非常に変動しやすく、経済指標の発表、地政学的イベント、市場心理、予期せぬニュースにより価格変動が突然かつ予測不可能になることがあります。この変動性は大きな利益をもたらすこともありますが、同様に大きな損失を招くこともあります。市場は迅速にポジションに逆行する可能性があり、ストップロスやリスク管理戦略は損失防止を保証せず、レバレッジは利益と損失の両方を増幅し、元本を超える損失を被ることもあります。
いかなる取引戦略、テクニカルインジケーター、または手法も利益を保証するものではありません。過去の実績は将来の結果を保証せず、過去の成功が将来の利益を確約するわけではありません。プロのトレーダーでさえ損失を経験し、市場状況は常に変化し、将来の動きを確実に予測することは不可能です。取引は推測や感情だけに基づくべきではありません。
レバレッジやマージントレードの使用は、少ない資本で大きなポジションをコントロールできますが、リスクも大幅に増加します。レバレッジは資本の急速な損失を招く可能性があり、マージンコールは不利な価格でのポジション清算を強制し、マージントレードは元本以上の損失を被ることがあります。さらに、流動性リスクやスリッページが発生することがあり、買い手や売り手が不足して注文が期待通りに執行されない場合があります。市場のギャップは価格の急激なジャンプを引き起こし、ストップロスレベルを完全に飛び越えることもあります。
取引には規律、忍耐、感情のコントロールが必要です。恐怖、強欲、自信過剰はしばしば悪い取引判断を招き、損失の可能性を高めます。感情的な取引は衝動的かつ非合理的な決定をもたらし、FOMO(取り残される恐怖)やリベンジトレードは過度なリスクテイクにつながります。明確な戦略を立て、リスク管理計画を守ることが重要です。
規制および法的リスクも考慮する必要があり、国や地域によって取引や投資に関する規制が異なります。一部の金融商品はお住まいの国で利用できない場合があり、規制の変更が市場状況に影響を与えることがあります。常に現地の法律および金融規制を遵守し、信頼できる規制されたブローカーや取引所で取引し、重大な財務リスクを伴う未規制のプラットフォームは避けてください。
取引は取引プラットフォーム、インターネット接続、ソフトウェアの実行に大きく依存しているため、技術的リスクも無視できません。遅延実行はインターネットやサーバーの問題により予期せぬ損失を招くことがあり、システム障害によりポジションが意図せず長時間開いたままになることもあります。オンライン取引プラットフォームの使用にはサイバーセキュリティリスクも存在します。
すべての取引情報、インジケーター、シグナル、ツールは教育目的のみで提供されており、金融アドバイスとはみなされません。トレーダーは自身で調査を行い、必要に応じて有資格の金融アドバイザーに相談してから投資判断を行うべきです。いかなるインジケーターや戦略も一貫した収益性を保証せず、すべての取引判断の責任は個々のトレーダーにあります。
取引における最も重要なルールは、失っても生活に支障のない資金でのみ取引することです。取引は本質的にリスクが高く、損失は元本を超えることがあります。失っても問題ない余剰資金でのみ取引し、借入金や生活必需費用は絶対に使用せず、資金を一つの取引や資産に集中させないよう分散投資を心がけてください。
取引は高リスクの活動であり、主な収入源として依存すべきではありません。多くのトレーダーは損失を出し、長期的に利益を上げるのはごく一部です。情報に基づいた判断を行い、リスクを管理し、常に責任を持って取引してください。いかなる取引プラットフォーム、ツール、インジケーターを使用する場合でも、取引に伴うリスクを認識し受け入れるものとします。
責任ある取引を。情報を得て。資本を守ろう。🚀
概要
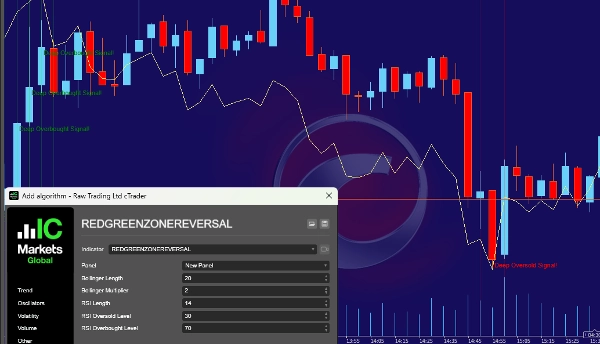
- Red Zone (Oversold): Closing price below the lower Bollinger Band and RSI below 30, signaling strong selling pressure and a potential buying opportunity.
- Green Zone (Overbought): Closing price above the upper Bollinger Band and RSI above 70, indicating strong buying pressure and a potential selling opportunity.
Visual markers include red-shaded zones for oversold conditions and green-shaded zones for overbought conditions. Alerts are provided via on-chart text notifications ("Deep Oversold Signal!" or "Deep Overbought Signal!") and sound signals when these conditions occur.
This tool assists traders by providing warning signals for potential market reversals at extreme price levels, helping to identify strong entry and exit points. It is suitable for various trading styles, including day trading, swing trading, and scalping, across different timeframes. The indicator supports markets such as forex, stocks, indices, and commodities.
カスタマーレビュー
5 | 100 % | |
4 | 0 % | |
3 | 0 % | |
2 | 0 % | |
1 | 0 % |


