


Açıklama
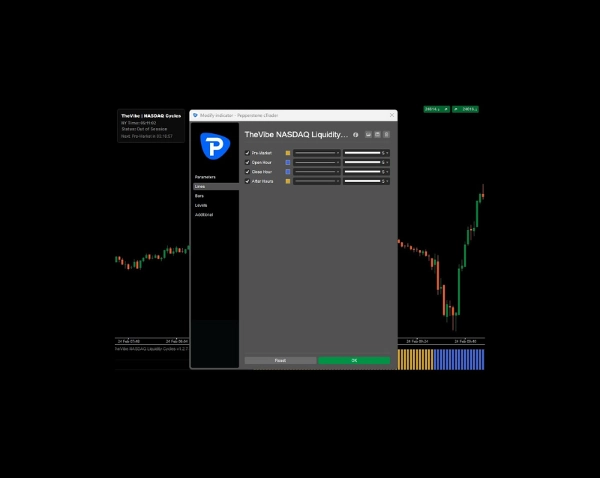
TheVibe NASDAQ Likidite Döngüleri, özellikle NASDAQ 100 için tasarlanmış profesyonel düzeyde bir oturum vurgulayıcıdır. Zaman dilimi farklarını manuel olarak takip etme veya hacmin ne zaman artacağını tahmin etme ihtiyacını ortadan kaldırarak, tam New York piyasa saatlerini görsel olarak önünüze koyar.
Mantık bar sayılarından ziyade mutlak zamana dayandığı için, bu gösterge tamamen zaman diliminden bağımsızdır—ister 1 dakikalık grafikte scalping yapıyor olun ister 1 saatlik grafikte swing trading, kusursuz çalışır.
Bu kimler için ve nasıl kullanılır: Bu gösterge, kurulumları için kesin zamanlama ve saf hacim kaynaklı volatiliteye güvenen günlük işlemciler ve momentum traderları için özel olarak tasarlanmıştır.
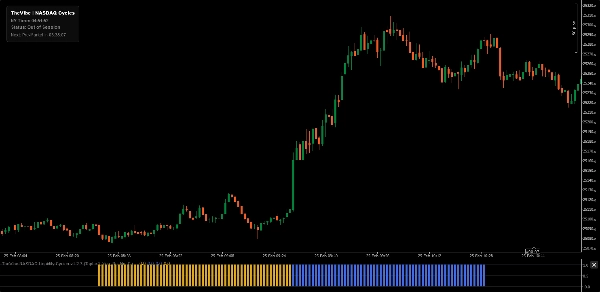
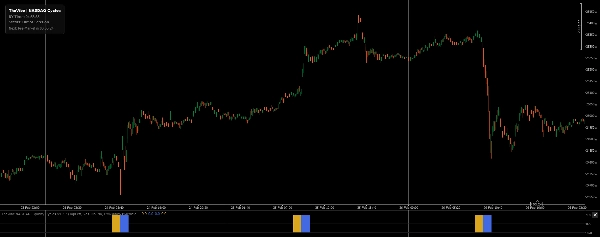
- Yorumlama: Gösterge, önemli bir likidite oturumu aktif olduğunda alt pencerede sağlam, renk kodlu histogram blokları çizer. Bu zamanlama verisi ekranınızda görsel olarak haritalandığında, ticaretinizi yüksek olasılıklı pencerelerle kolayca hizalayabilir ve dış bir saate bakmadan dalgalı, düşük likidite dönemlerinden kaçınabilirsiniz.
Takip Edilen Temel Likidite Aşamaları:
- Piyasa Öncesi (8:30 AM - 9:30 AM NY): Yüksek etkili haberler ve erken pozisyonlamaya odaklanan kurumsal Piyasa Öncesi saati.
- Açılış Saati (9:30 AM - 10:30 AM NY): İlk fiyat keşfi ve hacim akışı için önemli olan açılış zili volatilite penceresi.
- Kapanış Saati (3:00 PM - 4:00 PM NY): "Güç Saati" ve kapanış kesişimi, gün sonu kurumsal momentum ve pozisyon kapamayı vurgular.
- Mesai Sonrası (4:00 PM - 5:00 PM NY): Standart işlem sona ererken son likidite aşamasını yakalayan piyasa sonrası uzlaşma saati.
Ana Özellikler:
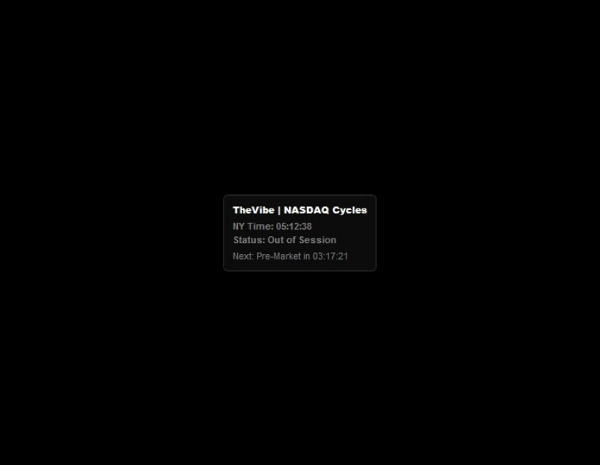
- Etkileşimli Geri Sayım Gösterge Paneli: Tam New York saatini, mevcut aktif oturumunuzu ve bir sonraki likidite penceresine canlı geri sayımı gösteren dinamik bir grafik üstü HUD.
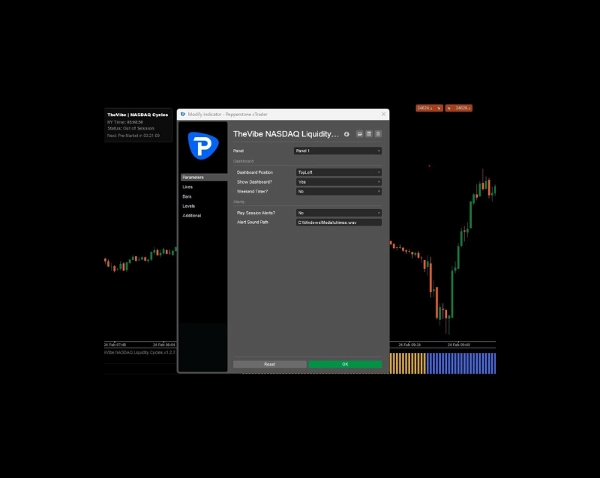
- Dinamik Konumlandırma: Gösterge panelini grafiğinizin dört köşesinden herhangi birine (varsayılan olarak Sol Alt) sabitleyerek fiyat hareketinizi tamamen engellemeden tutun.
- Gelişmiş Zaman Dilimi Motoru: Yerel veya broker sunucu zamanınızı tam New York saatiyle otomatik olarak senkronize eder (EST/EDT otomatik olarak yönetilir).
- Akıllı Hafta Sonu Mantığı: Geri sayımı hafta sonu gizlemeyi veya Pazartesi Piyasa Öncesi açılışına kalan tam gün ve saatleri göstermeyi seçin.
- Sesli Uyarılar: Hedeflenen likidite penceresi açılıp kapandığında tetiklenen isteğe bağlı bildirim zil sesleri.
Görüntüleme Önerisi: Optimal çalışma alanı yönetimi için, göstergenin alt pencere yüksekliğini kompakt bir boyuta ayarlayın. Bu, ana fiyat grafiğiniz için maksimum ekran alanını korurken günün likiditesinin net, rahatsız etmeyen bir "ritim çubuğunu" size sunar.
Not: Otomatik geri sayım sayacı, standart Pazartesi-Cuma işlem saatlerini varsayar ve ABD resmi tatilleri veya erken piyasa kapanışlarını otomatik olarak hesaba katmaz.
Özet
This timeframe-agnostic tool works across all chart intervals, from 1-minute scalping to 1-hour swing trading. It features an interactive countdown dashboard displaying current New York time, active session, and time remaining until the next liquidity window. The dashboard can be positioned in any chart corner to avoid obstructing price data. An advanced timezone engine synchronizes local or broker server time with New York time, automatically adjusting for EST/EDT. Additional features include smart weekend logic to manage countdown display and optional audio alerts signaling session openings and closings.
The indicator is intended for day and momentum traders relying on volume-driven volatility and precise timing. For optimal use, it is recommended to keep the sub-window compact to maintain chart clarity.
Müşteri değerlendirmeleri
5 | 25 % | |
4 | 75 % | |
3 | 0 % | |
2 | 0 % | |
1 | 0 % |
Tartışma
SSS


















Fiyat