
Professional-grade Anchored VWAP
지표
3 구매
버전 1.0, Nov 2025
Windows, Mac
4.5
리뷰: 2
설명
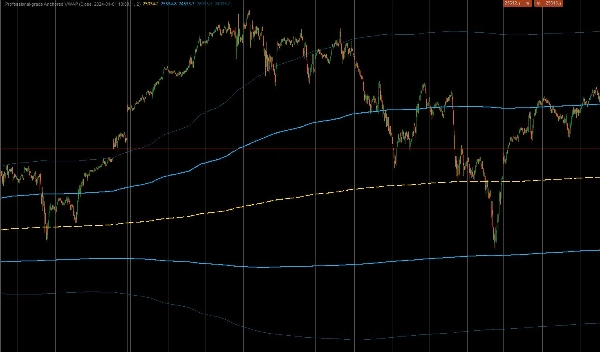
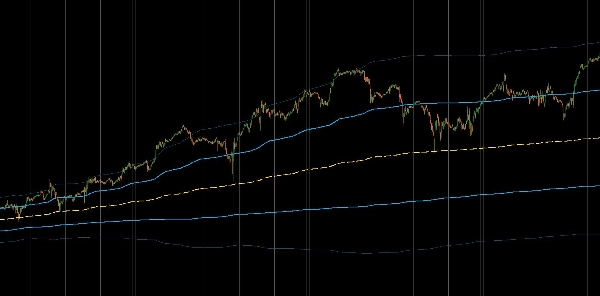
이것은 cTrader용 전문 등급 맞춤 지표로, 고정 볼륨 가중 평균 가격(AVWAP)을 계산하도록 설계되었습니다. 일일로 초기화되는 표준 VWAP 지표와 달리, 이 도구는 거래자가 CPI 발표, 시장 붕괴 또는 추세 시작과 같은 특정 고영향 이벤트에 계산을 "고정"할 수 있게 하여 그 순간부터의 평균 가격에 대한 진정한 기관 관점을 제공합니다. 또한 과도한 가격 움직임을 식별하기 위한 볼륨 가중 표준 편차 밴드를 포함합니다.
1. 핵심 계산 및 고정 논리
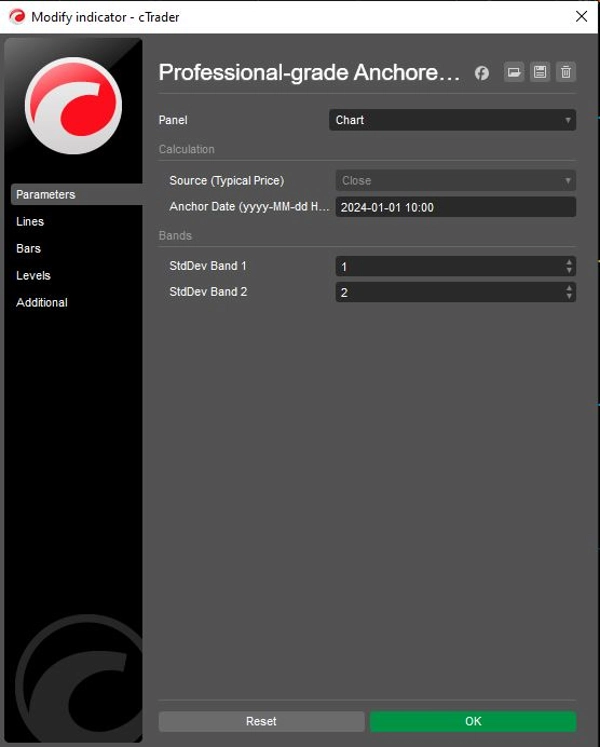
- 정밀 고정: 이 지표는 사용자 정의
Anchor Date(예: "2024-01-01 10:00")를 사용하여 해당 특정 분 이전의 모든 데이터를 엄격히 무시합니다. 이를 통해 평균 가격은 현재 특정 움직임 또는 시간대에 참여한 참가자만을 반영합니다. - 기관 공식: (가격 × 거래량)의 누적 합을 거래량의 누적 합으로 나누어 진정한 VWAP를 계산합니다.
- 일반 가격 소스: 기본적으로 계산에 "전형 가격"
(고가 + 저가 + 종가) / 3를 사용하며, 이는 기관 알고리즘이 공정 가치를 결정하는 표준 방법입니다. 다만, 이는 시가 또는 종가로 조정할 수 있습니다.
2. 고급 변동성 밴드
거래자가 시장 극단을 평가할 수 있도록, 이 지표는 볼륨 가중 분산을 기반으로 두 세트의 동적 밴드를 계산합니다:
- 밴드 1 (가치 영역): 기본값은 1.0 표준 편차입니다. 이 내부 영역은 일반적으로 시장의 "공정 가치" 노이즈를 포함합니다. 이 영역에서의 돌파는 종종 모멘텀을 신호합니다.
- 밴드 2 (극단 영역): 기본값은 2.0 표준 편차입니다. 이 외부 밴드에 도달한 가격은 통계적으로 과도하게 확장된 상태로, 종종 평균 회귀 기회(움직임 반전) 또는 강한 추세 소진을 신호합니다.
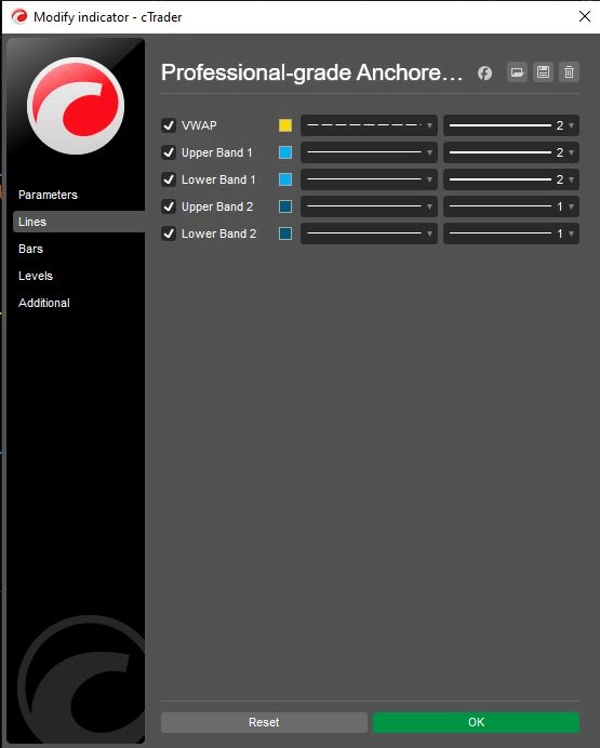
- 독립 제어: 두 밴드 모두 개별
Show토글(ShowBand1,ShowBand2)과 사용자 정의 가능한 편차 배수(Band1Dev,Band2Dev)를 포함하여 특정 변동성 전략에 맞춘 깔끔한 차트를 제공합니다.
3. 시각적 및 작동 논리
- 전략적 색상 코딩:
-
- 노란색 (VWAP): 중심 "자석" 또는 추세 기준선 역할을 합니다.
- 라임 그린 (밴드 1): 즉각적인 지지/저항 "가치 영역"을 나타냅니다.
- 빨간색 (밴드 2): 반전 확률이 증가하는 극단적 편차를 강조합니다.
- 상태 보존: 코드는 내부 상태 변수(
_cumVol,_cumPV)에 대해IndicatorDataSeries를 사용하여 과거 재계산 및 실시간 업데이트 중에도 값이 정확하게 유지되고 다시 그리기 오류가 발생하지 않도록 합니다.
논리 흐름 요약
- 초기화: 사용자의 특정 Anchor Date 문자열을 시스템 DateTime 객체로 구문 분석합니다.
- 시간 필터링: 각 바마다 현재 시간이 Anchor 이전인지 확인합니다. 그렇다면
NaN(그리지 않음)을 반환하고 누적 카운터를 0으로 재설정합니다. - 데이터 누적: Anchor 시간이 도달하면 현재 바의 거래량과 (가격 × 거래량)을 누적 합계에 추가하기 시작합니다.
- VWAP 계산: 누적 PV 총합을 누적 거래량 총합으로 나누어 VWAP 라인을 얻습니다.
- 분산 계산: 볼륨 가중 분산을 계산하고 표준 편차를 도출합니다.
- 밴드 그리기: 계산된 편차를 VWAP에 더하고 빼서 라임 및 빨간 밴드를 그립니다.
요약
AI 요약
This professional-grade custom indicator for cTrader calculates the Anchored Volume Weighted Average Price (AVWAP) and volume-weighted standard deviation bands from a user-defined start date. Unlike standard VWAP indicators that reset daily, it anchors the VWAP calculation to a specific event or time, such as a market release or trend start, providing an institutional perspective on average price since that anchor point.
Key features include:
- Precision anchoring to a user-specified date and time, ignoring data before that moment.
- Institutional VWAP calculation using cumulative (Price × Volume) divided by cumulative Volume.
- Default use of Typical Price ((High + Low + Close) / 3) for fair value, adjustable to Open or Close prices.
- Two dynamic volatility bands based on volume-weighted variance: Band 1 (1 standard deviation) representing the value zone, and Band 2 (2 standard deviations) indicating extreme price deviations.
- Independent toggles and customizable deviation multipliers for each band.
- Strategic color coding: yellow for VWAP, lime green for Band 1, and red for Band 2.
- Internal state preservation ensures accurate values during historical and real-time updates without repainting.
The indicator supports markets including Forex, indices, commodities, stocks, and cryptocurrencies, and is suitable for various symbols such as BTCUSD, EURUSD, GBPUSD, XAUUSD, and NAS100.
지표 프로필
고객 리뷰
4.5
리뷰: 2
5 | 50 % | |
4 | 50 % | |
3 | 0 % | |
2 | 0 % | |
1 | 0 % |
상담
자주 묻는 질문(FAQ)
BTCUSD
Forex
Breakout
Indices
EURUSD
Commodities
GBPUSD
NZDUSD
Bollinger
Fibonacci
Scalping
SMC
Crypto
Stocks
XAUUSD
NAS100
USDJPY
VWAP
트레이딩 봇, 지표, 플러그인 등 cTrader Store에서 제공되는 상품은 제3자 개발자에 의해 제공되며, 이는 단순히 정보 및 기술적 접근을 목적으로 제공된 것입니다. cTrader Store는 중개인이 아니며, 투자 조언, 개인별 추천 또는 향후 성과에 대한 어떠한 보장도 제공하지 않습니다.
이 작성자의 상품 더 보기


가격
가입일 26/09/2025
16
판매