
설명
트렌드 풀백 프로파일러
트렌드 풀백 프로파일러는 풀백의 깊이와 빈도를 측정하여 트렌드가 호흡하는 방식을 분석하기 위해 만들어진 cTrader 지표로, 이제는 피보나치 되돌림 %도 제공합니다.
EMA 기반 트렌드 필터를 사용하여, 이 지표는:
- 명확한 상승 추세 또는 하락 추세가 형성되었는지 감지합니다;
- 해당 추세 내에서 각 확인된 풀백을 식별합니다;
- 풀백 깊이(핍 단위)를 측정합니다;
- 마지막 임펄스 구간에 대한 피보나치 스타일 되돌림 백분율을 계산합니다;
- 다음 사항을 실시간으로 추적합니다:
-
- 현재 추세에서 발생한 풀백 수,
- 마지막 풀백 깊이,
- 평균 풀백 깊이,
- 마지막 피보나치 되돌림 %.
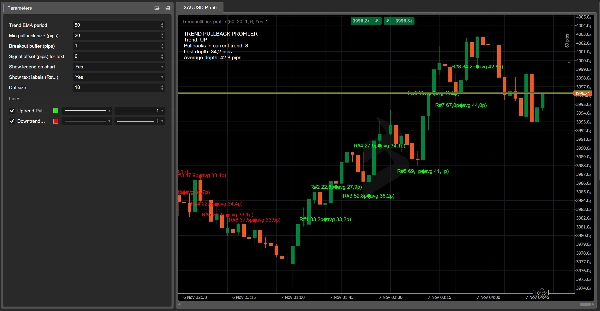
차트에서는 다음을 수행합니다:
- 상승 추세의 풀백 저점에 큰 녹색 점을 표시합니다,
- 하락 추세의 풀백 고점에 큰 빨간 점을 표시합니다,
- 선택적으로 다음과 같은 간결한 라벨을 출력합니다:
22.5 p / 38.2%.
왼쪽 상단 코너에는 동적 범례가 표시되어:
- 현재 추세 방향 (상승 / 하락 / 없음);
- 현재 추세 내 풀백 수;
- 마지막 풀백 깊이 (핍 단위);
- 평균 풀백 깊이 (핍 단위);
- 마지막 피보나치 되돌림 백분율.
주요 매개변수
- 트렌드 EMA 기간
트렌드 방향을 정의하는 데 사용되는 EMA 기간입니다. - 최소 풀백 크기 (핍)
유효한 되돌림으로 간주하기 위한 최소 풀백 깊이(핍 단위)입니다. - 돌파 버퍼 (핍)
새 구간을 확인하고 풀백을 종료하기 위해 가격이 이전 추세 극값을 넘어야 하는 추가 거리입니다. - 텍스트 신호 오프셋 (핍)
풀백 고점/저점에 대한 텍스트 라벨의 수직 오프셋입니다. - 차트에 범례 표시
추세, 마지막 및 평균 지표가 포함된 차트 내 범례를 토글합니다. - 점 근처에 텍스트 라벨 표시
활성화하면 점 옆에 풀백 깊이(및 선택적으로 피보나치 %)가 포함된 작은 라벨을 출력합니다. - 라벨에 피보나치 % 표시
활성화하면 라벨에 핍과 피보나치 %가 모두 표시됩니다 (XX.Xp / YY.Y%). - 점 크기
차트에서 점이 얼마나 크게 표시되는지 제어하여 낮은 시간대에서도 풀백을 쉽게 식별할 수 있습니다.
실용적인 사용 사례
- 특정 심볼/시간대에서 풀백이 보통 얼마나 깊은지 시각적으로 프로파일링합니다.
- 무작위 수준 대신 전형적인 되돌림 구간 주변에 제한 주문을 계획합니다.
- 비정상적으로 깊은 풀백(예: 61.8% 또는 78.6% 이상)을 발견하여 추세 소진 또는 가능한 반전을 신호할 수 있습니다.
- 추세 거래 전략에 객관적이고 수치적인 풀백 및 피보나치 정보를 추가합니다.
트렌드 풀백 프로파일러에서 피보나치 되돌림 계산 방법
트렌드 풀백 프로파일러는 임의의 고점과 저점이 아닌 마지막 임펄스 구간을 기준으로 피보나치 스타일 되돌림 백분율을 계산합니다.
상승 추세에서
- 지표는 다음 구간의 임펄스 구간을 추적합니다:
-
- 트렌드 기준 가격 = 마지막 중요한 저점 (이전 풀백의 끝)
- 트렌드 극값 = 트렌드의 마지막 스윙 고점
- 풀백이 형성되면, 지표는 다음을 측정합니다:
-
- 풀백 깊이 (가격):
depthPrice = trendHigh – pullbackLow - 임펄스 구간 크기:
legSize = trendHigh – trendBasePrice
- 풀백 깊이 (가격):
- 피보나치 되돌림 백분율은 다음과 같습니다:
Fib% = (depthPrice / legSize) * 100
따라서 가격이 마지막 임펄스의 약 38.2%–50%만큼 되돌린 후 다시 상승하면, 38.2%, 50%, 61.8% 등에 가까운 값이 표시됩니다.
하락 추세에서
- 임펄스 구간은 다음에서 시작됩니다:
-
- 트렌드 기준 가격 = 마지막 중요한 고점 (이전 풀백의 끝)
- 트렌드 극값 = 트렌드의 마지막 스윙 저점
- 풀백은 추세에 반하여 상승하며, 지표는 다음을 측정합니다:
-
- 풀백 깊이 (가격):
depthPrice = pullbackHigh – trendLow - 임펄스 구간 크기:
legSize = trendBasePrice – trendLow
- 풀백 깊이 (가격):
- 같은 공식:
Fib% = (depthPrice / legSize) * 100
이렇게 차트에 표시되는 모든 점은 현재 추세의 명확한 임펄스 내 풀백을 나타내며, 이는 핍과 피보나치 %로 표현되어 되돌림이 얕은지, 전형적인지, 아니면 비정상적으로 깊은지 빠르게 판단할 수 있습니다.
요약
AI 요약
Trend Pullback Profiler is a cTrader indicator designed to analyze trend behavior by measuring the depth and frequency of pullbacks within a trend. It uses an EMA-based filter to detect clear uptrends or downtrends and identifies confirmed pullbacks during these trends. The indicator measures pullback depth in pips and calculates Fibonacci-style retracement percentages relative to the last impulse leg of the trend.
Key features include:
- Detection of trend direction and pullbacks.
- Measurement of pullback depth and Fibonacci retracement percentage.
- Live tracking of the number of pullbacks, last pullback depth, average pullback depth, and last Fibonacci retracement percentage.
- Visual chart elements such as large green dots at pullback lows in uptrends and large red dots at pullback highs in downtrends.
- Optional compact labels displaying pullback depth and Fibonacci percentage.
- A dynamic legend showing current trend direction, pullback counts, and metrics.
The Fibonacci retracement is calculated based on the last impulse leg, defined by the last significant trend base and extreme prices, providing objective numeric data to assess whether retracements are shallow, typical, or unusually deep. The indicator supports various markets including Forex, indices, commodities, cryptocurrencies, and stocks. It offers configurable parameters such as EMA period, minimum pullback size, breakout buffer, and display options for labels and legend.
지표 프로필
고객 리뷰
4.5
리뷰: 2
5 | 50 % | |
4 | 50 % | |
3 | 0 % | |
2 | 0 % | |
1 | 0 % |
고객 리뷰
November 10, 2025
tested small first and that felt like the right move, and it is just a support layer.
November 10, 2025
상담
자주 묻는 질문(FAQ)
BTCUSD
Forex
Signal
Breakout
Indices
EURUSD
Commodities
GBPUSD
NZDUSD
RSI
Martingale
Fibonacci
Prop
Scalping
SMC
Crypto
Grid
Stocks
AI
XAUUSD
NAS100
ATR
USDJPY
트레이딩 봇, 지표, 플러그인 등 cTrader Store에서 제공되는 상품은 제3자 개발자에 의해 제공되며, 이는 단순히 정보 및 기술적 접근을 목적으로 제공된 것입니다. cTrader Store는 중개인이 아니며, 투자 조언, 개인별 추천 또는 향후 성과에 대한 어떠한 보장도 제공하지 않습니다.


가격
42.11M
거래량
6.13M
핍 수익
228
판매
8.47K
무료 설치