
LT_Ind_TradeNet
Indicateur
1 achats
Version 1.0, Oct 2025
Windows, Mac
5.0
Avis : 1
Description
Note : testé uniquement sur cTrader Windows.
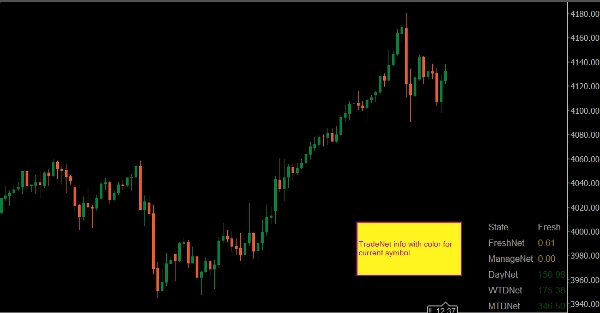
LT_Ind_TradeNet est un indicateur de suivi des profits ciblé pour un seul symbole de trading.
Il aide les traders à rester disciplinés en montrant combien ils ont gagné pour la journée, la semaine et le mois en cours — séparés en états de trading clairs.
États
- NoTrade – pas de position ouverte
- Fresh – nouveaux trades vers l’objectif du jour
- Manage – gestion des trades existants ou chevauchants
- Leftover – trades restants après l’objectif ou la fin de la session
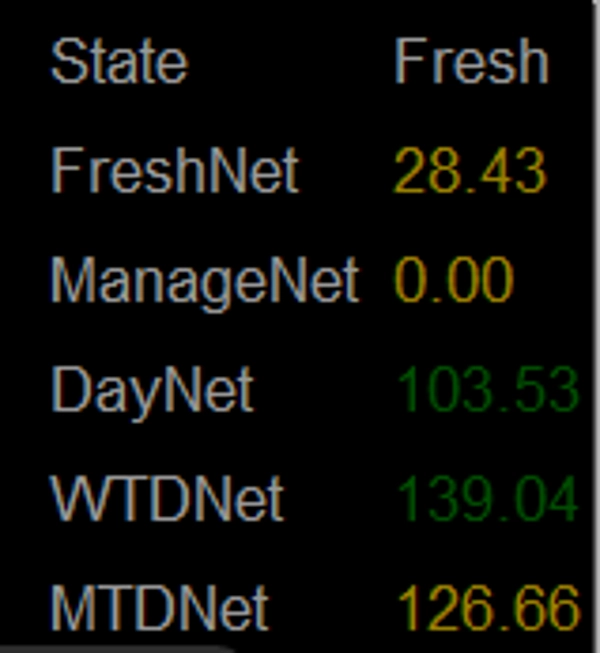
Métriques affichées
- FreshNet – profit net des trades unilatéraux
- ManageNet – profit net de tous les trades chevauchants (des deux côtés)
- DayNet – profit total pour la journée en cours
- WTDNet – profit depuis le début de la semaine
- MTDNet – profit depuis le début du mois
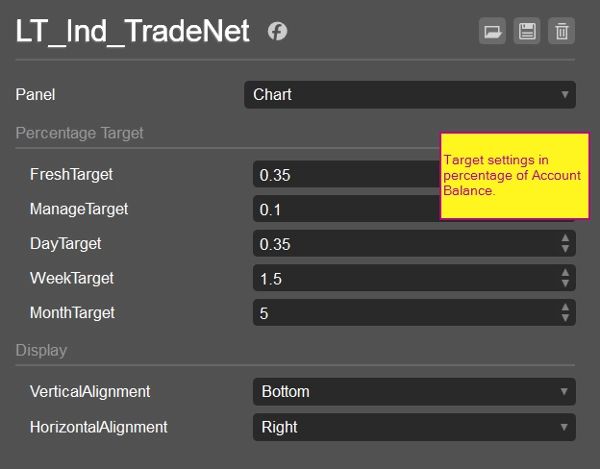
Objectif
- Permet aux traders de rester concentrés sur des objectifs quotidiens ou hebdomadaires réalistes
- Réduit les comportements émotionnels et avides en définissant un point clair de « assez »
- Fournit un retour simple pour décider de continuer à trader ou d’arrêter pour la session
Points forts
- Spécifique au symbole : chaque graphique montre sa propre performance
- Léger et non intrusif
- Idéal pour les traders en direct suivant des objectifs de profit quotidiens/hebdomadaires structurés
Principe fondamental :
Assez est la clé pour gagner.
Résumé
Profil de l'indicateur
Avis clients
5.0
Avis : 1
5 | 100 % | |
4 | 0 % | |
3 | 0 % | |
2 | 0 % | |
1 | 0 % |
Discussion
Questions fréquentes
Prop
Forex
Indices
Commodities
Crypto
Stocks
Les produits disponibles sur cTrader Store, notamment les bots de trading, les indicateurs et les plug-ins, sont fournis par des développeurs tiers et mis à disposition à titre informatif et à des fins d'accès technique uniquement. cTrader Store n'est pas un courtier et ne fournit aucun conseil en investissement, aucune recommandation personnelle ni aucune garantie quant aux performances futures.


Prix
Depuis le 25/09/2024
34
Ventes