
Description
Note : testé uniquement sur cTrader Windows.
LT_Ind_Pivot est un indicateur de points pivots puissant et personnalisable pour cTrader qui aide à visualiser les niveaux clés du marché et les structures de session sur plusieurs périodes.
Il calcule et trace automatiquement Pivot (P), Support (S1–S5), Résistance (R1–R5), et CPR (TC/BC) basés sur votre période d'ancrage choisie — de H1, H4, H8, H12, D1, W1, à Month1.
L'indicateur trace également des lignes séparatrices verticales pour chaque période d'ancrage, à la fois sur le graphique principal et les panneaux d'indicateurs, facilitant la distinction des limites de session ou de période.
Vous pouvez définir exactement quels niveaux afficher en utilisant une notation flexible telle que :
P, S1, R1– niveaux standardsPS1,S1S2,R1R2, etc. – niveaux intermédiaires entre pivots et supports/résistances principauxTC,BC– plage centrale de pivot (CPR)
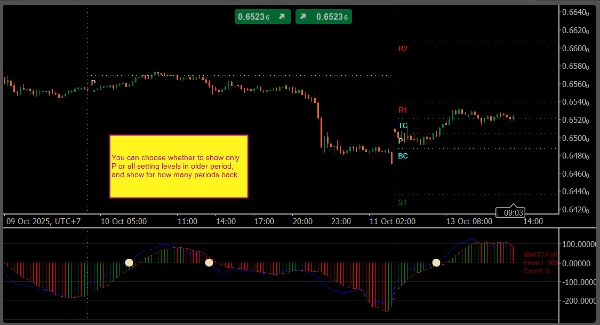
Les contrôles d'affichage vous permettent de définir combien de pivots historiques garder visibles, s'il faut afficher les étiquettes texte/prix, et comment colorer ou styliser chaque niveau.
Fonctionnalités principales
- Points d'ancrage pivot : H1, H4, H8, H12, D1, W1, Month1
- Syntaxe de niveau personnalisée :
P, Sx, Rx, PS1, S1S2, R1R2, TC, BC - Séparateurs verticaux de période sur le graphique et les panneaux d'indicateurs
- Option d'afficher texte, prix et anciens niveaux pivot
- Personnalisation complète des couleurs et styles de ligne
- Léger et adapté au trading en direct
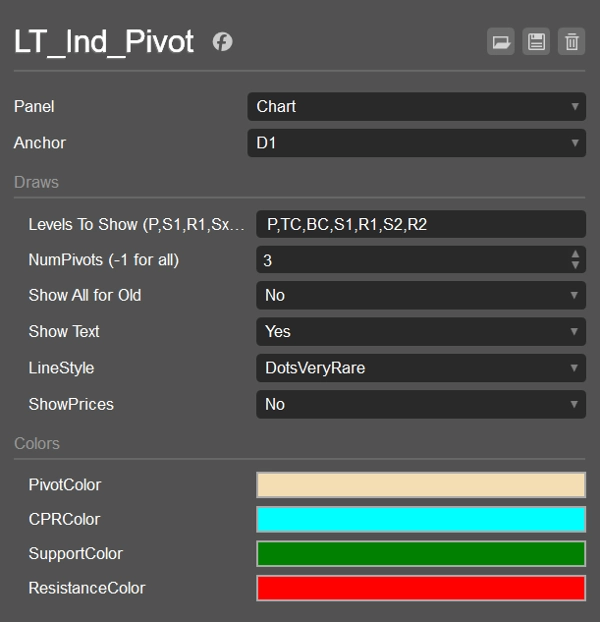
Paramètres par défaut
- Ancre : D1
- Afficher les niveaux :
P,S1,R1 - NumPivotsBack : 1
- ShowAllForOldPivots : false
- Afficher le texte : true
- Afficher les prix : false
- Style de ligne : Solide
- Couleurs : Pivot = Blé, CPR = Cyan, Support = Vert, Résistance = Rouge
Cas d'utilisation
- Marquer les zones de support/résistance intrajournalières et swing
- Suivre CPR et niveaux intermédiaires pour les configurations de cassure ou de retour à la moyenne
- Utiliser les séparateurs de période pour analyser la structure session par session
- Combiner avec les indicateurs VWAP ou Swing pour une confluence plus forte
Résumé
Avis clients
5 | 0 % | |
4 | 100 % | |
3 | 0 % | |
2 | 0 % | |
1 | 0 % |


![Logo de "[Hamster-Coder] Moving Average MTF"](https://cdn.ctrader.com/image/webp/b11b98b1-194d-4b8e-b00e-d611826ad159_31226)


