
LT_SmartSwings
Indikator
6 käufe
Version 1.0, Jun 2025
Windows, Mac
5.0
Bewertungen: 1
Beschreibung
Hinweis: Getestet nur auf cTrader Windows.
LT_SmartSwings ist ein leistungsstarker, schwingungsbasierter Marktstrukturindikator, der Händlern hilft, wichtige Wendepunkte, Marktbewegungen und Ausbruchsereignisse klar und flexibel zu visualisieren. Entwickelt für Präzision und Anpassungsfähigkeit, ist dieses Tool ideal für Händler, die sich auf Swing-Logik, Fibonacci-Konfluenz und Ausbruchsanalysen verlassen.
Hauptfunktionen:
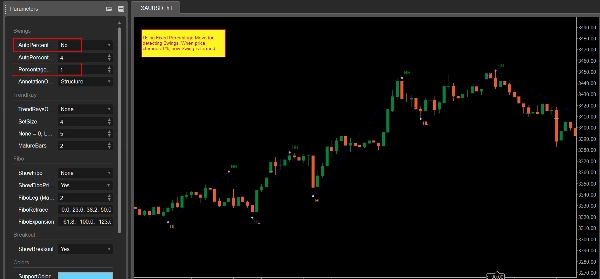
- Erkennung von Swing-Hochs/-Tiefs basierend auf prozentualer Kursbewegung
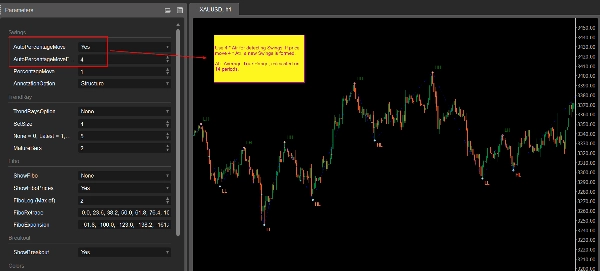
- Automatischer oder manueller Schwellenwert: Verwenden Sie festen % oder den Automodus (basierend auf ATR x Faktor)
- ZigZag-Linie verbindet wichtige Swings
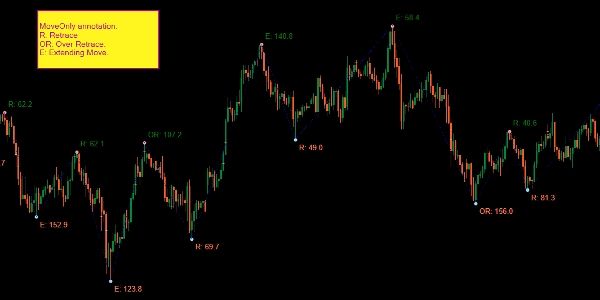
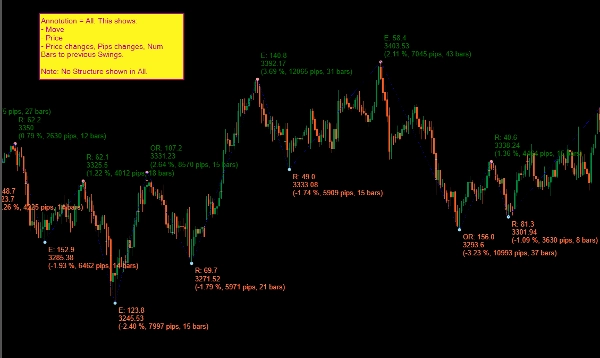
- Detaillierte Anmerkungen mit 5 Modi:
-
- Struktur: HH, HL, LH, LL
- MoveOnly: Retrace (R) und Extension (E) Prozentsätze
- PriceOnly
- MoveNPrice
- Alle: Bewegung %, Pips, Bars, Preis, Bewegungstyp
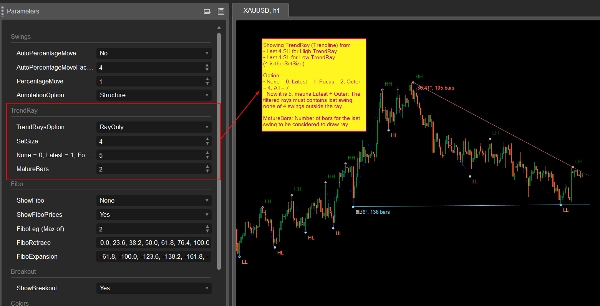
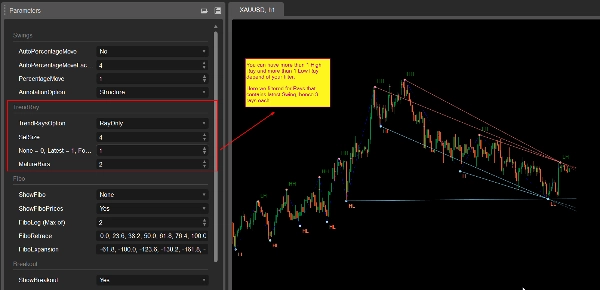
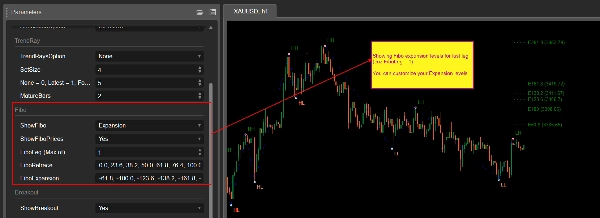
- Trendstrahl-Projektion (mit mehreren Filteroptionen):
-
- Zeichnet Strahlen von aktuellen Swings mit intelligenten Einschränkungen
- Optionen: Neueste, Fokus (Steigung), Außen oder Alle
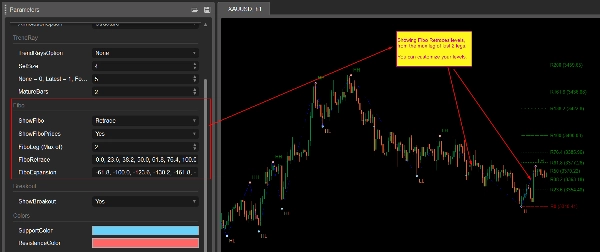
- Automatische Fibonacci-Level:
-
- Zeichnet Retracement- oder Erweiterungslevel basierend auf aktuellen Bewegungen
- Benutzerkonfigurierbare Level-Sets
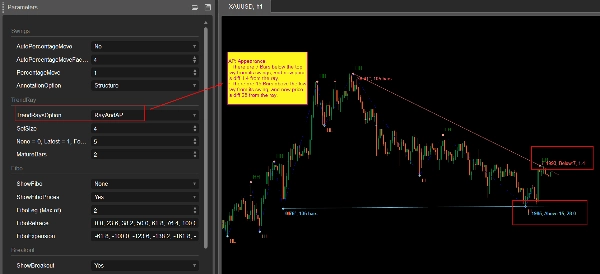
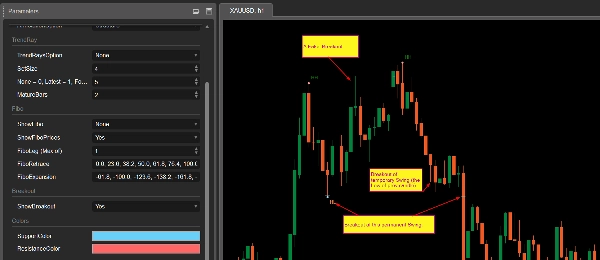
- Ausbruchsmarkierung:
-
- Erkennt Ausbrüche von Swing-Punkten (sowohl bestätigte als auch falsche Ausbrüche)
- Persistente Anzeige zur historischen Referenz
- Farb-Anpassung für Unterstützungs-/Widerstandslinien
Anwendungsfälle:
- Dynamische Identifikation von Unterstützung/Widerstand
- Verstehen der Swing-Struktur und Übergänge
- Erkennen von Trendfortsetzung oder Umkehr mithilfe von Fibs
- Visualisierung von Ausbruchspunkten für die Handelsplanung
- Kombinieren mit Ihren bestehenden Systemen oder diskretionären Strategien
Empfohlene Verwendung:
- An Ihr Arbeitszeitfenster anhängen (z.B. M30, H1)
- Am besten geeignet für manuelle Händler, Struktur-Analysten und bestätigungsbasierte Strategien
Einführungsangebot: Jetzt verfügbar für nur 15 $!
Zusammenfassung
KI-Zusammenfassung
LT_SmartSwings is a swing-based market structure indicator designed for traders to identify key turning points, market moves, and breakout events with precision and flexibility. It detects swing highs and lows based on price movement percentage, using either fixed or automatic thresholds derived from ATR. The indicator connects key swings with a ZigZag line and provides detailed annotations in five modes, including structure (HH, HL, LH, LL), move percentages, price-only, combined move and price, and comprehensive move data.
Additional features include trend ray projection with multiple filtering options, automatic Fibonacci retracement and expansion levels customizable by the user, and breakout marking that detects both confirmed and false breakouts with persistent historical display. Support and resistance lines can be color-customized.
Use cases cover dynamic support/resistance identification, understanding swing structure and transitions, spotting trend continuation or reversal via Fibonacci levels, visualizing breakout points for trade planning, and integration with existing trading systems or discretionary strategies. It is recommended for manual traders, structure analysts, and confirmation-based strategies, and is intended for use on working timeframes such as M30 or H1. The indicator has been tested on cTrader Windows.
Indikatorprofil
Kundenbewertungen
5.0
Bewertungen: 1
5 | 100 % | |
4 | 0 % | |
3 | 0 % | |
2 | 0 % | |
1 | 0 % |
Diskussion
Häufig gestellte Fragen (FAQ)
Breakout
ATR
Über den cTrader Store verfügbare Produkte, einschließlich Handelsbots, Indikatoren und Plugins, werden von externen Entwicklern bereitgestellt und nur zu Informations- und technischen Zugriffszwecken verfügbar gemacht. cTrader Store ist kein Broker und erbringt keine Anlageberatung, persönlichen Empfehlungen oder eine Garantie für zukünftige Performance.


Preis
Seit 25/09/2024
34
Verkäufe