
Açıklama
Doğrusal Regresyon Osilatörü (LRO) , fiyat trendlerinin momentumunu ve yönünü değerlendirmek için finansal piyasalarda yaygın olarak kullanılan doğrusal regresyon analizine dayanan teknik bir göstergedir. Mevcut fiyat ile belirli bir dönem boyunca en iyi uyum sağlayan doğrusal regresyon çizgisi tarafından tahmin edilen değer arasındaki mesafeyi ölçer. İşte nasıl çalıştığı ve bileşenlerinin bir özeti:
Doğrusal Regresyon Osilatörünün Temel Bileşenleri
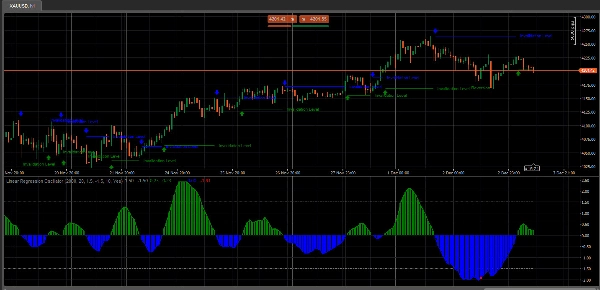
- Doğrusal Regresyon Çizgisi (En İyi Uyum Çizgisi): Bu çizgi, belirli bir dönem boyunca beklenen fiyat hareketini temsil eder ve doğrusal regresyon teknikleri kullanılarak hesaplanır. Çizginin eğimi trendin yönünü gösterir: pozitif eğim yükseliş trendini, negatif eğim ise düşüş trendini işaret eder.
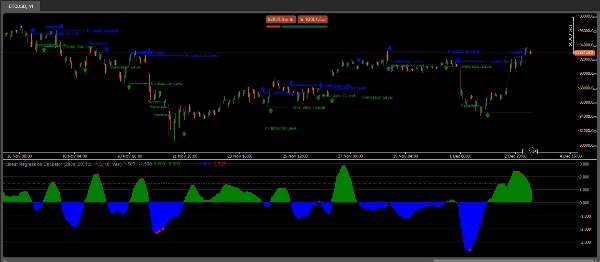
- Osilatör Değerleri: Osilatör değeri, mevcut fiyat ile doğrusal regresyon çizgisi arasındaki sapmanın ölçülmesiyle hesaplanır. Bu sapma, genellikle sıfır çizgisi etrafında salınan bir osilatör değeri olarak çizilir.
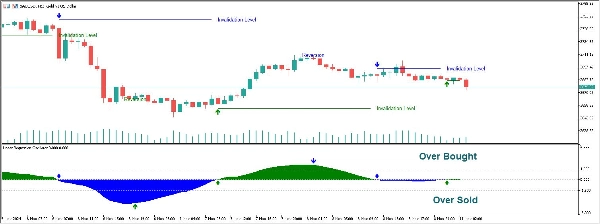
- Sıfır Çizgisi: LRO grafiğinde sıfır çizgisi bir temel çizgi olarak görev yapar. Osilatör değeri sıfır çizgisinin üzerine çıktığında yükseliş momentumu, altına indiğinde ise düşüş momentumu önerir.
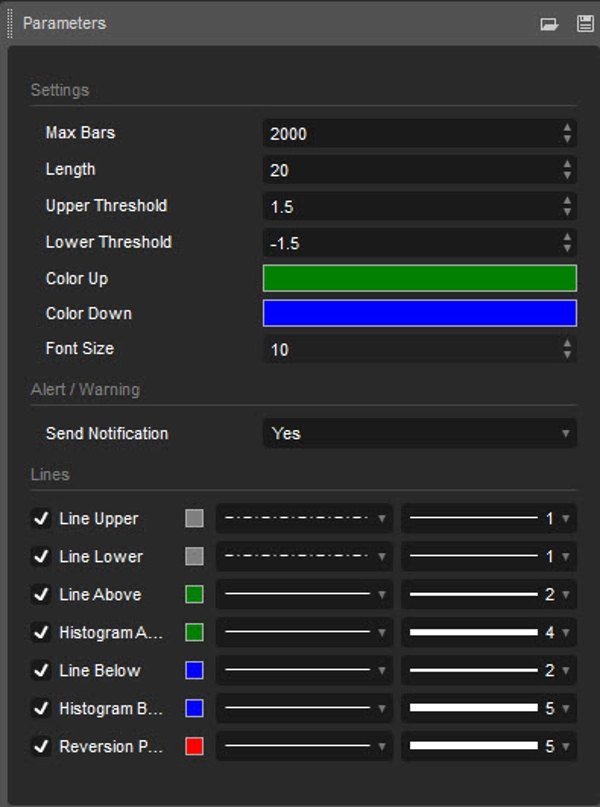
- Ayarlar ve Dönemler: Dönem ayarı, doğrusal regresyon çizgisinin hesaplanması için dikkate alınan bar veya veri noktası sayısını tanımlar. Yatırımcılar, tercih ettikleri analiz zaman dilimine bağlı olarak kısa veya uzun vadeli ticaret stratejilerine uyacak şekilde bu ayarı ayarlarlar.
Yatırımcıların Doğrusal Regresyon Osilatörünü Kullanma Yöntemleri
- Trendleri Belirleme: LRO, mevcut fiyat trendinin momentumunu, fiyat ile beklenen (regresyon) çizgisi arasındaki göreceli mesafeyi göstererek yatırımcıların görmesini sağlar.
- Aşırı Alım/Aşırı Satım Seviyeleri: Osilatördeki aşırı değerler aşırı alım veya aşırı satım koşullarını gösterebilir, bu da potansiyel bir dönüşü veya pozisyonların ayarlanması gerektiğini işaret eder.
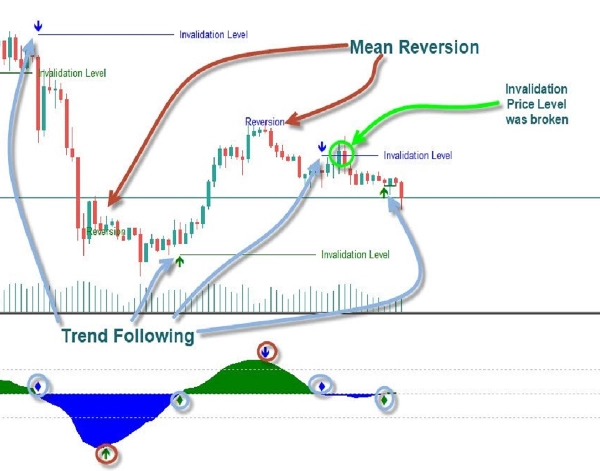
- Uyumsuzluk Sinyalleri: Fiyat hareketleri ile LRO göstergesi arasında uyumsuzluk olduğunda, bu momentumun zayıfladığını veya olası bir dönüşü işaret edebilir.
Yorumlama İpuçları
- Sıfır Çizgisini Geçme: Sıfırın üzerine geçiş, yükselen bir trendin ortaya çıktığını gösterebilirken, sıfırın altına geçiş düşüş trendini işaret eder.
- Dönem Ayarlarını Değiştirme: Daha kısa dönemler LRO'yu daha hassas yapar, hızlı fiyat hareketlerini yakalar ancak gürültüyü artırır. Daha uzun dönemler dalgalanmaları yumuşatır ve uzun vadeli trendleri belirlemek için uygundur.
Kullanım Notları:
- Uzunluk: Doğrusal regresyonun hesaplandığı dönemi belirler
- Üst/Alt Eşik: Aşırı alım ve aşırı satım koşullarını belirlemek için üst ve alt sınırları tanımlar. Bu eşiklerin dışındaki değerler potansiyel dönüşleri işaret eder.
Doğrusal Regresyon Osilatörü, istatistiksel analizi trend takip prensipleriyle birleştirmesi nedeniyle değerli bir araçtır ve hem momentum hem de trend yatırımcıları için çok yönlüdür. Özellikle, regresyon trend çizgisinden sapmalara dayanarak trend devamlarını veya dönüşlerini belirlemede trend piyasalarında faydalıdır.
Özet
Müşteri değerlendirmeleri
5 | 0 % | |
4 | 100 % | |
3 | 0 % | |
2 | 0 % | |
1 | 0 % |


!["High-Low Divergence [Iridio Capital]" logosu](https://cdn.ctrader.com/image/webp/443c4661-7abb-40f1-842f-4b6ec560649b_40914)


