
Descripción
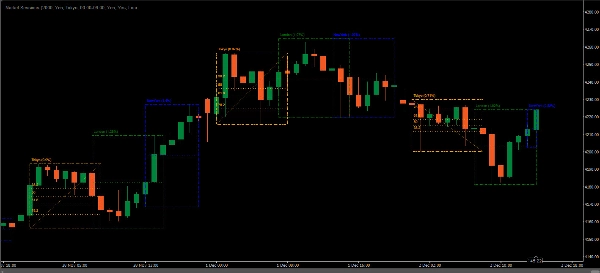
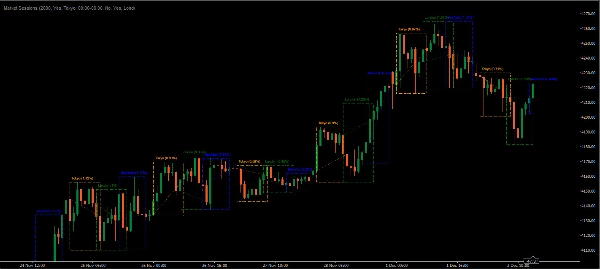
El indicador Market Sessions es una herramienta popular entre los traders de forex y acciones para representar visualmente las sesiones de trading globales en un gráfico de precios. Destaca los períodos de tiempo de las principales sesiones de trading — como las Asiática (Tokio), Europea (Londres), y Americana (Nueva York) directamente en el gráfico. Esto ayuda a los traders a identificar cuándo abren y cierran los mercados, permitiendo una mejor toma de decisiones basada en el comportamiento de trading específico de cada sesión.
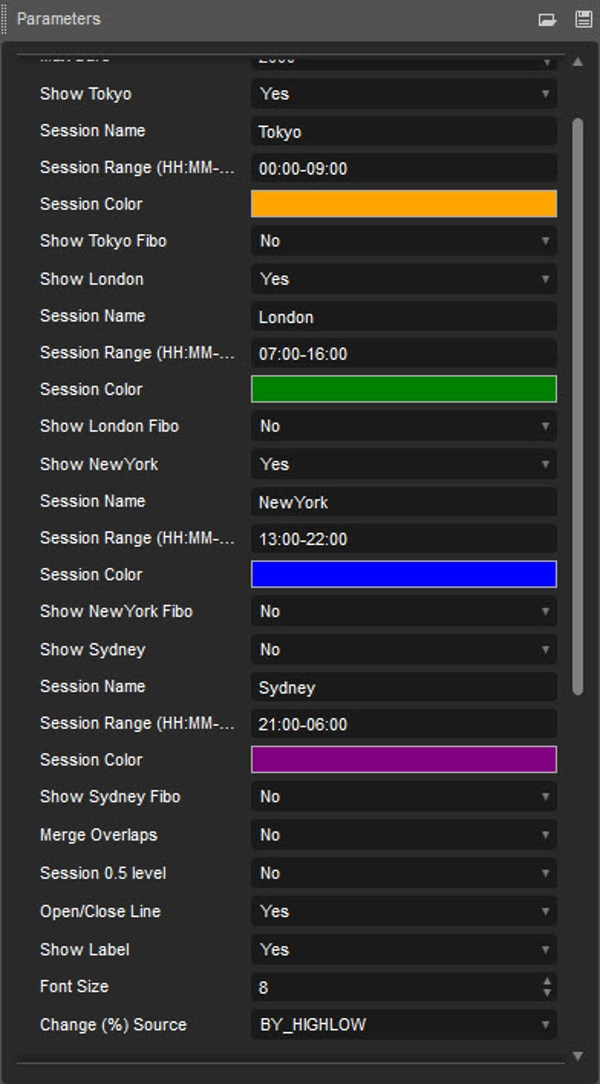
- Sesión Asiática (Predeterminado: 00:00-09:00)
- Sesión de Londres (Predeterminado: 07:00-16:00)
- Sesión de Nueva York (Predeterminado: 13:00-22:00)
- Sesión de Sídney (Predeterminado: 21:00-06:00)
Características clave del indicador Market Sessions
- Horario de las sesiones y solapamientos:
-
- El indicador marca las horas de inicio y fin de cada sesión. Esta función es útil ya que cada sesión tiene características únicas — la sesión asiática, por ejemplo, suele ser más tranquila, mientras que la sesión de Londres a menudo presenta alta volatilidad. También se marcan los solapamientos, como el solapamiento Londres-Nueva York, indicando momentos de mayor actividad.
- Colores personalizables para las sesiones:
-
- Los traders a menudo pueden personalizar los colores para cada sesión, lo que facilita distinguirlas visualmente. Esta personalización añade claridad y ayuda a los traders a centrarse en las sesiones que prefieran.
- Zonas horarias ajustables:
-
- Dado que los traders están ubicados globalmente, el indicador generalmente permite ajustar las zonas horarias, alineando los horarios de inicio y fin de las sesiones con la hora local del trader, lo cual es especialmente útil para quienes están en zonas horarias diferentes a los principales centros de trading.
- Estrategias específicas para cada sesión:
-
- Cada sesión tiene características distintas. Por ejemplo, la sesión de Londres suele ser la más volátil, presentando oportunidades de ruptura, mientras que la sesión asiática tiende a ser más tranquila, lo que puede favorecer estrategias de trading en rango. Entender estas particularidades permite a los traders adaptar sus estrategias según las tendencias de cada sesión.
¿Por qué usar el indicador Market Sessions?
- Mejor sincronización de las operaciones:
-
- Al saber qué sesión está activa, los traders pueden ajustar sus estrategias para aprovechar diferentes niveles de volatilidad y liquidez.
- Mejora en el análisis y desarrollo de estrategias:
-
- Con los horarios de las sesiones marcados visualmente, los traders pueden analizar el comportamiento del precio a lo largo de las sesiones para desarrollar y perfeccionar estrategias que se adapten mejor a las características de cada sesión.
- Mayor conciencia de la volatilidad del mercado:
-
- La volatilidad suele aumentar durante las aperturas, cierres y solapamientos de sesiones. El indicador ayuda a anticipar estos movimientos, reduciendo la probabilidad de ser sorprendido por cambios repentinos en el mercado.
Ejemplo de caso de uso
Un trader interesado en la volatilidad podría enfocarse en el período de solapamiento Londres-Nueva York para aprovechar un mayor movimiento del mercado. Usando el indicador Market Sessions, puede planificar operaciones para coincidir con este solapamiento, aumentando potencialmente las probabilidades de capturar movimientos significativos del precio.
En resumen, el indicador Market Sessions es esencial para los traders que desean tomar decisiones informadas basadas en comportamientos del mercado específicos por horario. Proporciona claridad, mejora el análisis y puede apoyar estrategias de trading más efectivas.
Resumen
Valoraciones de clientes
5 | 33 % | |
4 | 67 % | |
3 | 0 % | |
2 | 0 % | |
1 | 0 % |


