
Daily TPO profile
Indicador
213 descargas
Versión 1.0, Nov 2025
Windows, Mac
Descripción
Perfil TPO diario
Indicador de perfil TPO diario que calcula POC, VAH y VAL para cada sesión.
Dibuja el Punto de Control y el Área de Valor del 70% directamente en el gráfico, ayudándote a identificar zonas de valor justo, niveles clave de soporte/resistencia y posibles áreas de rechazo o aceptación del precio.
Cómo funciona
Este indicador construye un perfil TPO (Time Price Opportunity) diario, similar a un Perfil de Mercado.
Para cada barra del día de trading, él:
- divide el eje de precios en “pasos” fijos definidos por “Tamaño de fila (pips)”
- para cada paso de precio, cuenta cuántas barras tocaron ese nivel (TPO = cuántas veces se negoció el precio allí)
- al final del día calcula:
-
- POC (Punto de Control) → el nivel de precio con el mayor número de TPOs (donde el mercado pasó más tiempo)
- VAH (Valor Área Alto) y VAL (Valor Área Bajo) → los niveles de precio que contienen aproximadamente Porcentaje del Área de Valor (por defecto 70%) de todos los TPOs para esa sesión
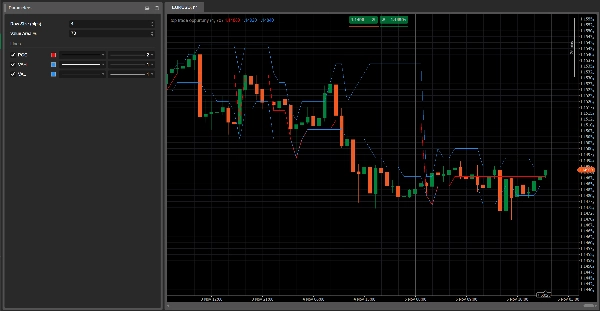
El indicador dibuja tres líneas horizontales en el gráfico:
- Línea roja → POC
- Líneas azules → VAH (superior) y VAL (inferior)
Estas líneas se actualizan barra por barra durante la sesión y se reinician cuando comienza un nuevo día de trading.
Parámetros principales
Tamaño de fila (pips)
Define el grosor de cada paso de precio en el perfil.-
- Valores más pequeños = perfil más detallado
- Valores más grandes = perfil más suave
Porcentaje del Área de Valor
Porcentaje del total de TPOs contenido dentro del Área de Valor (típicamente 70%).
El Área de Valor es la zona de precio donde ocurrió la mayor parte de la actividad del mercado durante el día.
Cómo interpretarlo
- POC (línea roja)
-
- El nivel de precio más “aceptado” por el mercado durante ese día.
- A menudo actúa como un nivel de equilibrio: el precio puede rebotar, detenerse o romper fuertemente alrededor de esta zona.
- Área de Valor (VAH–VAL, líneas azules)
-
- Representa la zona de “valor justo” donde se realizó la mayor parte del trading.
- La acción del precio relativa a VAH/VAL puede mostrar:
-
- Rechazo de precios extremos (falsos rompimientos más allá de VAH/VAL)
- Aceptación de nuevos precios (consolidación fuera del Área de Valor)
Ideas típicas de uso
- El precio rechaza VAL y vuelve a entrar en el Área de Valor → idea potencial de compra, apostando a un retorno al “valor justo” (reversión a la media).
- El precio rompe por encima de VAH con fuerza y comienza a construir estructura por encima → posible inicio de una nueva área de valor superior (escenario de seguimiento de tendencia).
- Varios días con POCs alrededor del mismo nivel → zona fuerte de equilibrio/acumulación, a menudo soporte/resistencia clave.
Resumen
Resumen de IA
The Daily TPO Profile indicator constructs a daily Time Price Opportunity (TPO) profile similar to a Market Profile, analyzing market activity by price levels throughout each trading session. It divides the price axis into fixed increments ("Row Size" in pips) and counts how many bars traded at each price step, representing TPOs. At the end of the session, it calculates three key levels: the Point of Control (POC), where the market spent the most time; the Value Area High (VAH); and the Value Area Low (VAL), which together define the price range containing approximately 70% of the trading activity.
The indicator plots these levels as horizontal lines on the chart—POC in red, VAH and VAL in blue—updating them bar by bar during the session and resetting daily. Traders use the POC as an equilibrium price level that may act as support or resistance. The Value Area highlights fair value zones, with price action near VAH and VAL signaling potential rejection or acceptance of price extremes. Typical applications include identifying mean reversion opportunities when price rejects VAL or trend-following setups when price breaks above VAH.
Main adjustable parameters include Row Size (pips), controlling profile detail, and Value Area %, defining the percentage of TPOs included in the value area. The indicator supports analysis across various markets including forex, indices, commodities, stocks, and cryptocurrencies.
Perfil del indicador
Valoraciones de clientes
0.0
Valoraciones: 0
Valoraciones de clientes
Este producto todavía no se ha valorado. ¿Ya lo ha probado? Sea el primero en informar a otros.
Conversación
Preguntas frecuentes
Signal
Indices
Commodities
GBPUSD
RSI
Bollinger
Fibonacci
Scalping
AI
XAUUSD
NAS100
MACD
BTCUSD
Forex
Breakout
EURUSD
NZDUSD
Martingale
Prop
ZigZag
Supertrend
Fair Value Gap
SMC
Crypto
Grid
Stocks
ATR
USDJPY
VWAP
Los productos disponibles a través de cTrader Store, incluidos bots, indicadores y plugins para operar, son proporcionados por desarrolladores de terceros y están disponibles únicamente con fines informativos y de acceso técnico. cTrader Store no es un bróker, por lo que no proporciona asesoramiento de inversión, recomendaciones personales ni ninguna garantía de rentabilidad futura.


Precio
42.11M
Volumen operado
6.13M
Pips ganados
224
Ventas
8.41K
Instalaciones gratis