
Descripción
El ZLEMA (Media Móvil Exponencial de Retardo Cero) es una versión avanzada de la Media Móvil Exponencial (EMA) diseñada para reducir el retardo comúnmente asociado con las EMAs tradicionales. Al usar un método de cálculo especializado, ZLEMA reacciona más rápidamente a los cambios de precio, haciéndola especialmente efectiva en mercados volátiles.
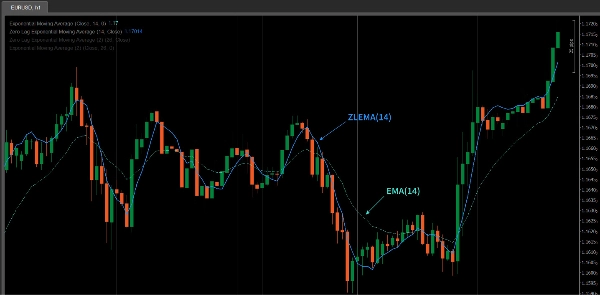
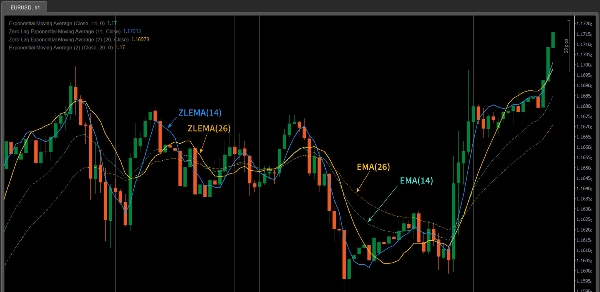
La característica clave de ZLEMA es su propiedad de "retardo cero", que le permite seguir los movimientos de precio más de cerca, particularmente en condiciones de mercado de rápido movimiento. En comparación con la EMA tradicional, ZLEMA ofrece tiempos de respuesta más rápidos, haciéndola más oportuna para capturar tendencias del mercado.
ZLEMA vs EMA
- Velocidad de Respuesta: ZLEMA reacciona más rápido que la EMA tradicional. Al compensar el retardo, sigue los cambios de precio con mayor prontitud.
- Efecto de Suavizado: ZLEMA mantiene un efecto de suavizado similar al de la EMA, mientras minimiza el retardo del precio, haciéndola más adecuada para mercados de rápido movimiento.
- Caso de Uso: Si operas en un mercado altamente volátil (como el trading a corto plazo o intradía), ZLEMA puede superar a la EMA en términos de capacidad de respuesta.
Características del Indicador ZLEMA
- Respuesta de Retardo Cero: ZLEMA reduce el retardo, permitiéndole responder rápidamente a las fluctuaciones del precio en el mercado, haciéndola más precisa para capturar cambios rápidos del mercado.
- Suavidad: A pesar de ofrecer una respuesta más rápida, ZLEMA conserva el efecto de suavizado de la EMA, ayudando a evitar el ruido causado por las fluctuaciones del precio.
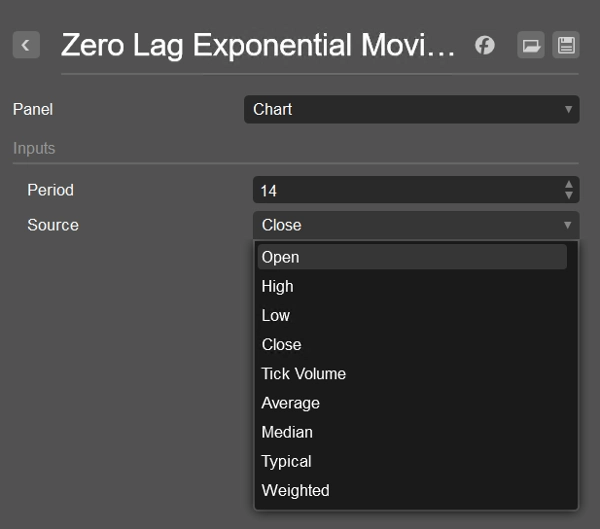
- Flexibilidad: ZLEMA puede usarse con diferentes fuentes de datos de precio (como
Close,Open,High, etc.), permitiendo a los traders ajustarla según las necesidades de su estrategia. - Seguimiento de Tendencias y Confirmación de Señales de Reversión: ZLEMA es ideal para identificar cambios de tendencia, especialmente en mercados volátiles, y para confirmar señales de reversión de precio.
Cómo Usar el Indicador ZLEMA
- Traders a Corto Plazo: ZLEMA es perfecto para traders a corto plazo ya que puede responder rápidamente a las fluctuaciones de precio. Su rápida reacción la hace ideal para capturar reversiones de tendencia a corto plazo o señales de ruptura.
- Seguimiento de Tendencias: ZLEMA también puede usarse para seguir tendencias a largo plazo pero ofrece más sensibilidad que la EMA. En una tendencia fuerte, ZLEMA ayuda a identificar el inicio o el fin de las tendencias más rápidamente, asistiendo en ajustes oportunos de la estrategia.
- Combinación con Otros Indicadores: ZLEMA funciona bien cuando se combina con otros indicadores técnicos como RSI, MACD o análisis de patrones de precio para mejorar la precisión de las señales. Es especialmente útil cuando se combina con indicadores de seguimiento de tendencia como medias móviles para confirmar rupturas o reversiones de precio.
- Confirmación de Rupturas y Reversiones: ZLEMA puede ayudar a confirmar rupturas de precio desde niveles clave o señales de reversión. Por ejemplo, cuando el precio cruza la línea ZLEMA, podría indicar un cambio de tendencia, y viceversa.
- Reducción de Ruido: Debido a su retardo reducido, ZLEMA es mejor para filtrar el ruido que podría estar presente en medias móviles tradicionales, convirtiéndola en una herramienta importante en trading intradía o mercados altamente volátiles.
Consejos para Usar ZLEMA
- Ajusta el Período: Ajusta el período de ZLEMA según tu estilo de trading y la volatilidad del mercado. Para operaciones a corto plazo, usa un período más corto (por ejemplo, 10 o 14), mientras que para seguimiento de tendencias a largo plazo, un período más largo (por ejemplo, 50 o 100) puede ser más apropiado.
- Combina con Otras Herramientas: Aunque ZLEMA ofrece excelentes capacidades de seguimiento de tendencias, combinarla con otros indicadores como RSI para condiciones de sobrecompra/sobreventa o MACD para la fuerza de la tendencia puede mejorar la precisión.
- Pruebas y Optimización: El rendimiento de ZLEMA puede variar según las condiciones del mercado. Se recomienda hacer backtesting y optimizarla a fondo antes de usarla en trading en vivo para asegurar los mejores resultados en tu estrategia.
Resumen
Key features include:
- Zero lag response for timely reaction to price fluctuations.
- Smoothness that filters out noise without sacrificing responsiveness.
- Flexibility to use various price data inputs such as Close, Open, or High prices.
- Utility in trend following and confirming reversal signals.
ZLEMA is particularly useful for short-term traders seeking to capture rapid trend reversals or breakouts, as well as for longer-term trend tracking with enhanced sensitivity compared to EMA. It can be combined with other indicators like RSI or MACD to improve signal accuracy and confirm price breakouts or reversals.
Users can adjust the indicator’s period to match their trading style and market conditions, optimizing performance through backtesting. ZLEMA helps reduce noise and lag, making it a valuable tool for intraday and volatile market trading.


![Logotipo de "[Stellar Strategies] Inside Bar with Signals"](https://cdn.ctrader.com/image/webp/1d9e8bfa-3b2c-4440-bb37-5856902008a7_30683)


