
คำอธิบาย
ตัวชี้วัด Pinescriptlabs Store: 🤖Pinescriptlabs Store cBots : (cBot)
Gold & BTC BreakoutSession Pivots(ใหม่)
SmartTrend Support &
Resistance
Lines
Dynamic
Market Structure
Analysis
of
Turning Points
Fibonacci
Linear
Regression
Multi-timeframe
Multi-Level
Candle Bias
Tracker
Auto
Support and
Resistance
Trend
Lines
All
Support and
Resistance
Levels
Z-Score แปลงราคากลายเป็น "มาตราส่วน
ส่วนเบี่ยงเบนมาตรฐาน",
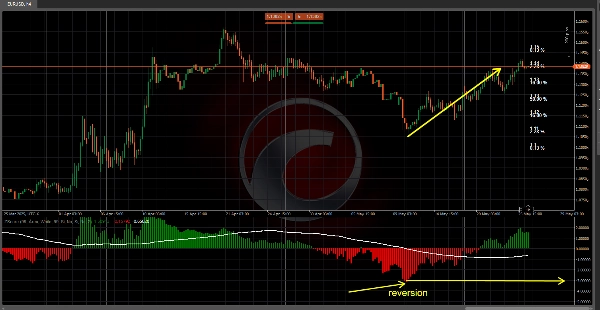
แสดงให้เห็นว่าปิดแท่งเทียนแต่ละแท่ง (หรือเปิด, สูง, ต่ำ) เบี่ยงเบนจากค่าเฉลี่ยในอดีตมากแค่ไหน ด้วย ภาพที่เข้าใจง่าย ช่วยระบุ สภาวะซื้อมาก/ขายมากเกินไป
และ โซนกลับตัวที่มีความน่าจะเป็นสูง! 🔄
1️⃣ มันทำอะไร?
🔹 มาตรฐานราคา: แปลงค่าปิดสัมบูรณ์เป็น Z-Score—จำนวนส่วนเบี่ยงเบนมาตรฐานจากค่าเฉลี่ย
ของ N แท่งเทียนล่าสุด.
🔹 เน้น
ค่าผิดปกติทางสถิติ: ค่าที่
ใกล้ ±1, ±2, หรือ ±3 บ่งชี้ความผิดปกติในการเคลื่อนไหวของราคา:
- ±1 SD (≈ ความน่าจะเป็น 68% ระหว่าง –1 ถึง 1)
- ±2 SD (≈ ความน่าจะเป็น 95% ระหว่าง –2 ถึง 2)
- ±3 SD (≈ ความน่าจะเป็น 99.7% ระหว่าง –3 ถึง 3)
🔹 ช่วย
ในการเทรดแบบ Mean Reversion:
เมื่อ Z-Score เกิน ±2 หรือ ±3 ตลาดอยู่ในโซน
สุดขีด และมักจะกลับสู่ค่าเฉลี่ย (ศูนย์)
🔹 ภาพที่ชัดเจน
การแสดงผล: ใช้ ฮิสโตแกรม (หรือแท่งเทียนพิเศษ), เส้นค่าเฉลี่ยเคลื่อนที่ และโซนสี คุณสามารถเห็นได้ทันทีว่าราคากำลังแสดงพฤติกรรม "ปกติ" หรือเป็น
ค่าผิดปกติทางสถิติ.
2️⃣ มันทำงานอย่างไร?
📐 การคำนวณค่าเฉลี่ยและส่วนเบี่ยงเบนมาตรฐาน
- ใช้ช่วงเวลาย้อนหลัง
(เช่น 99
แท่งเทียน) - คำนวณค่าเฉลี่ยและส่วนเบี่ยงเบนมาตรฐาน (SD)
ของราคาปิด - SD สูง = ความผันผวนของราคาเพิ่มขึ้น.
🧮 สูตร Z-Score
Z=Current Close−Historical MeanStandard DeviationZ=Standard DeviationCurrent Close−Historical Mean
- Z บวก → ปิด เหนือ ค่าเฉลี่ย
- Z ลบ → ปิด ต่ำกว่า ค่าเฉลี่ย
📊 ความน่าจะเป็นในตาราง Z
- เน้นคอลัมน์ Z-Score ปัจจุบันเพื่อแสดง ความหายาก/ความสุดขั้ว ของราคา!
3️⃣ วิธีใช้ในการเทรด
✅ Mean Reversion: มองหา Z > +2 หรือ Z < –2 เพื่อเทรดกลับตัว (ขายเมื่อซื้อมากเกินไป
และซื้อเมื่อขายมากเกินไป)
✅ ยืนยันแนวโน้ม: Z ที่คงที่
> 0 + ค่าเฉลี่ยเคลื่อนที่ที่เพิ่มขึ้น บ่งชี้ความแข็งแกร่ง;
Z < 0 + ค่าเฉลี่ยเคลื่อนที่ที่ลดลง บ่งชี้ความอ่อนแอ.
✅ การจัดการความเสี่ยง: ใกล้ ±1 SD, คาดหวังการเคลื่อนไหวปกติ; ใกล้ ±3
SD, ปรับจุดหยุดและขนาดตำแหน่งอย่างระมัดระวัง
✅ จังหวะการเข้า: รวม Z-Score สุดขั้วกับระดับสนับสนุน/ต้านทาน
เพื่อการเข้าเทรดที่แม่นยำ.
4️⃣ ข้อดีและข้อควรพิจารณา
✔️ ข้อดี
- ข้อได้เปรียบทางสถิติ ในการตรวจจับสภาวะราคาสุดขั้ว
- โหมดการแสดงผลหลายแบบ (ฮิสโตแกรม, แท่งเทียน, แถบ, ตารางความน่าจะเป็น)
- ปรับแต่งง่าย (ความยาว, สี, ประเภทแผนภูมิ)
⚠️ ข้อควรพิจารณา:
- ใน แนวโน้มที่แข็งแกร่ง
ราคาอาจอยู่ในสถานะ "สุดขั้ว" เป็นเวลานานโดยไม่กลับตัว - สมมติฐานการแจกแจงแบบ
ปกติ—อาจไม่เหมาะกับตลาดที่มีความผันผวนสูงหรือเบ้ - เหมาะสำหรับใช้ในสภาพแวดล้อมที่มี
ความผันผวนคงที่.
สรุป
The indicator calculates the mean and standard deviation of recent closing prices to determine the Z-Score using the formula:
Z = (Current Close − Historical Mean) / Standard Deviation.
Positive Z-Scores indicate prices above the mean, while negative scores indicate prices below it.
ZScore Reversion provides clear visualizations through histograms, special candles, moving averages, and colored zones to distinguish normal price behavior from statistical outliers. It supports mean reversion trading by signaling when prices exceed ±2 or ±3 standard deviations, suggesting a likely return to the mean. It also aids trend confirmation by interpreting sustained positive or negative Z-Scores combined with moving average trends.
Risk management is facilitated by adjusting stops and position sizes near extreme Z-Score values. Entry timing can be refined by combining extreme Z-Scores with support and resistance levels. The indicator offers multiple display modes and customization options for length, colors, and chart types. It is best suited for stable volatility environments and assumes a normal distribution of price data.
รีวิวจากลูกค้า
5 | 100 % | |
4 | 0 % | |
3 | 0 % | |
2 | 0 % | |
1 | 0 % |


