
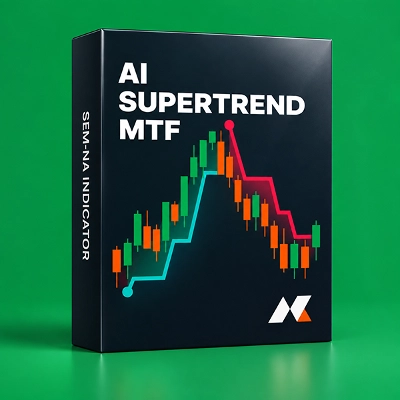
AI Supertrend MTF
อินดิเคเตอร์
3 การซื้อ
เวอร์ชัน 1.0, Jul 2026
Windows, Mac

565.08M
ปริมาณการเทรด
9.79M
Pips ที่ได้กำไร
4
การขาย
คำอธิบาย
ภาพรวม:
เบื่อกับตัวบ่งชี้ Supertrend แบบดั้งเดิมที่ตามหลังการเปลี่ยนแปลงตลาดอย่างกะทันหันหรือไม่? AI Supertrend MTF นิยามใหม่ของการติดตามแนวโน้มโดยผสานรวมอัลกอริทึมการเรียนรู้ของเครื่อง K-Nearest Neighbors (K-NN) ที่เรียนรู้จากการเคลื่อนไหวราคาล่าสุด (RSI, ATR, Momentum) อย่างต่อเนื่องและปรับความไวโดยอัตโนมัติเพื่อกำจัดสัญญาณเท็จในตลาดที่ผันผวนในขณะที่จับการเบรกเอาต์ขนาดใหญ่ได้ทันที
คุณสมบัติหลัก:
- 🤖 เครื่องยนต์การเรียนรู้ของเครื่อง: ใช้ธนาคารความจำที่ขยายตัวและการถ่วงน้ำหนักคุณลักษณะแบบไดนามิกเพื่อแยกแยะระหว่างแนวโน้มที่แท้จริงและเสียงรบกวนของตลาด
- 📊 การฉายภาพหลายกรอบเวลา (MTF): เห็นภาพรวมที่ใหญ่ขึ้น! ฉายภาพสูงสุดถึงสองกรอบเวลาที่สูงกว่า (เช่น 1H และรายวัน) ลงบนแผนภูมิกรอบเวลาที่ต่ำกว่าปัจจุบันของคุณ ออกแบบด้วยตรรกะบิตไวส์ที่เข้มงวดเพื่อรับประกัน ไม่มีการทาสีใหม่ และไม่มีการรั่วไหลของข้อมูลในอนาคต
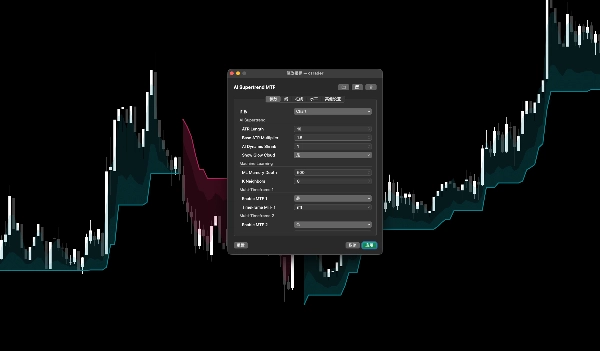
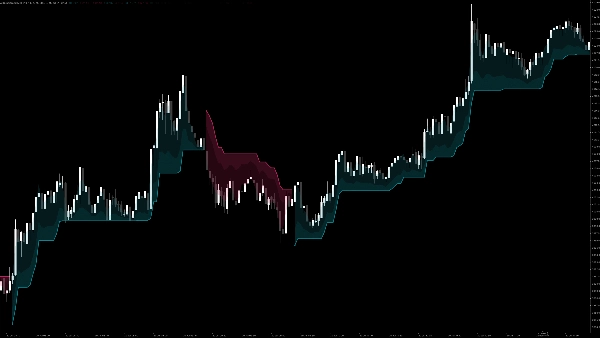
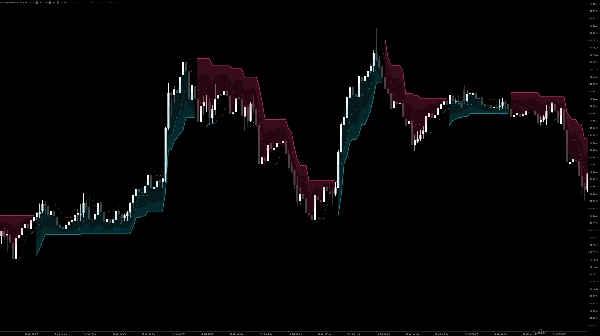
- ✨ เมฆเรืองแสงแบบไดนามิก: การอัปเกรดภาพที่น่าทึ่ง แสดงเมฆไล่ระดับสามชั้นที่เรียบเนียนและไม่รบกวนเพื่อแสดงถึงความแข็งแกร่งและโซนแนวรับ/แนวต้านของแนวโน้มปัจจุบัน
- ⚙️ ปรับแต่งได้สูง: ปรับความลึกของหน่วยความจำ AI, จำนวนเพื่อนบ้าน K และความละเอียด MTF ได้โดยตรงจากแผงพารามิเตอร์เนทีฟของ cTrader
วิธีใช้ (คู่มือผู้ใช้):
- แนบกับแผนภูมิ: ใช้ตัวบ่งชี้กับกรอบเวลาที่คุณชื่นชอบ เส้นแนวโน้มหลักจะแสดงทิศทางที่คำนวณโดย AI ในปัจจุบันทันที
- เปิดใช้งาน MTF (ไม่บังคับ): เลื่อนลงในการตั้งค่าไปที่
Multi-Timeframe 1และMulti-Timeframe 2. ทำเครื่องหมายที่ช่อง "Enable" และเลือกกรอบเวลาที่สูงกว่าที่คุณต้องการ เส้นประจะปรากฏขึ้นเพื่อแสดงแนวโน้มขนาดใหญ่ - กลยุทธ์การเทรด:
-
- สัญญาณซื้อ: เมื่อเส้นแนวโน้มหลักเปลี่ยนเป็นสีฟ้าอมเขียว (อยู่ต่ำกว่าราคา) และเส้นกรอบเวลาที่สูงกว่าใน MTF ก็เป็นสีฟ้าอมเขียวเช่นกัน (แนวโน้มสอดคล้องกัน)
- สัญญาณขาย: เมื่อเส้นแนวโน้มหลักเปลี่ยนเป็นสีแดง (อยู่สูงกว่าราคา) และเส้นกรอบเวลาที่สูงกว่าใน MTF ก็เป็นสีแดงเช่นกัน
- ออกจากการซื้อขาย: ใช้แถบเมฆเรืองแสงเป็นระดับหยุดขาดทุนแบบตามหลังแบบไดนามิก
สรุป
สรุปโดย AI
AI Supertrend MTF is a trend-following indicator that integrates a K-Nearest Neighbors (K-NN) machine learning algorithm to reduce lag and false signals typical of traditional Supertrend indicators. It continuously learns from recent price action metrics including RSI, ATR, and momentum, adapting its sensitivity to distinguish true trends from market noise and to capture breakouts promptly.
Key features include multi-timeframe (MTF) projection, allowing users to overlay trend information from up to two higher timeframes onto the current chart without repainting or future data leaks. The indicator visually represents trend strength and support/resistance zones through dynamic, three-layer glowing clouds. Users can customize AI memory depth, K-neighbors, and MTF settings via the native parameter panel.
To use, apply the indicator to any timeframe to see the AI-calculated trend direction. Optional MTF lines display macro trends from higher timeframes. Buy and sell signals are generated when the main trendline and MTF lines align in color (cyan for buy, red for sell). The glowing cloud bands serve as dynamic trailing stop-loss levels.
This indicator supports visualization, signals, and filtering functions, and requires bar, tick, and volume data inputs. It is categorized under trend indicators and incorporates RSI and ATR for momentum and volatility analysis.
โปรไฟล์อินดิเคเตอร์
หมวดหมู่อินดิเคเตอร์
Trend
ประเภทเอาต์พุต
การแสดงเป็นภาพ
ตัวกรอง
สัญญาณ
ข้อกำหนดด้านข้อมูล
แท่งเท่านั้น
ข้อมูล Tick
ปริมาณ
สัญญาณที่รองรับ
Cross
Breakout
Reversal
ความแข็งแกร่งของแนวโน้ม
ความผันผวน
เบรก Level ที่ระบุ
การสนทนา
รีวิวจากลูกค้า
0.0
รีวิว: 0
รีวิวจากลูกค้า
ยังไม่มีรีวิวสำหรับผลิตภัณฑ์นี้ หากเคยลองแล้ว ขอเชิญมาเป็นคนแรกที่บอกคนอื่น!
คำถามที่พบบ่อย
Supertrend
RSI
ATR
ผลิตภัณฑ์ที่มีให้บริการผ่าน cTrader Store รวมถึงบอทการเทรด อินดิเคเตอร์ และปลั๊กอิน มีให้บริการโดยนักพัฒนาบุคคลที่สามและมีไว้เพื่อวัตถุประสงค์ในการเข้าถึงข้อมูลและทางเทคนิคเท่านั้น cTrader Store ไม่ใช่โบรกเกอร์และไม่ได้ให้คำแนะนำการลงทุน คำแนะนำส่วนบุคคล หรือการรับประกันผลการดำเนินงานในอนาคต
เพิ่มเติมจากผู้เขียนคนนี้







ราคา
565.08M
ปริมาณการเทรด
9.79M
Pips ที่ได้กำไร
4
การขาย