
WVAP-Bands Indicator_noSourceCode
อินดิเคเตอร์
1 การซื้อ
เวอร์ชัน 1.0, Sep 2025
Windows, Mac
4.5
รีวิว: 2
คำอธิบาย
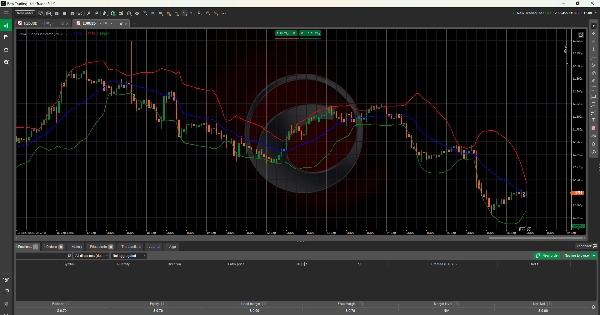
VWAP Bands - การวิเคราะห์ปริมาณมืออาชีพ
เปลี่ยนแปลงการเทรดของคุณด้วยความแม่นยำระดับสถาบัน
ตัวบ่งชี้ VWAP Bands มอบการวิเคราะห์ราคาถ่วงน้ำหนักด้วยปริมาณแบบมืออาชีพพร้อมแถบส่วนเบี่ยงเบนมาตรฐานแบบไดนามิก ใช้โดยเทรดเดอร์สถาบันทั่วโลกเพื่อระบุจุดเข้าและออกที่เหมาะสม
🚀 คุณสมบัติหลัก
- การคำนวณ VWAP ที่แท้จริง: ราคาถ่วงน้ำหนักด้วยปริมาณโดยใช้วิธี HLC/3
- แถบไดนามิก: แถบบน/ล่างที่อิงตามส่วนเบี่ยงเบนมาตรฐานถ่วงน้ำหนักด้วยปริมาณ
- การปรับแต่งเต็มรูปแบบ: ปรับช่วงเวลา สี และตัวคูณความกว้างแถบได้
- การวิเคราะห์แบบเรียลไทม์: อัปเดตทุกแท่งเพื่อข้อมูลตลาดทันที
📊 การใช้งานในการเทรด
- ซื้อมาก/ขายมากเกินไป: แถบบน = สัญญาณขาย, แถบล่าง = สัญญาณซื้อ
- แนวรับ/แนวต้านแบบไดนามิก: VWAP ทำหน้าที่เป็นระดับอ้างอิงของสถาบัน
- การกลับตัวสู่ค่าเฉลี่ย: เทรดการกลับตัวเมื่อราคาขยายไปถึงขอบแถบ
- การยืนยันแนวโน้ม: การเบรกเอาต์ที่แข็งแกร่งผ่านแถบเป็นสัญญาณของการดำเนินต่อ
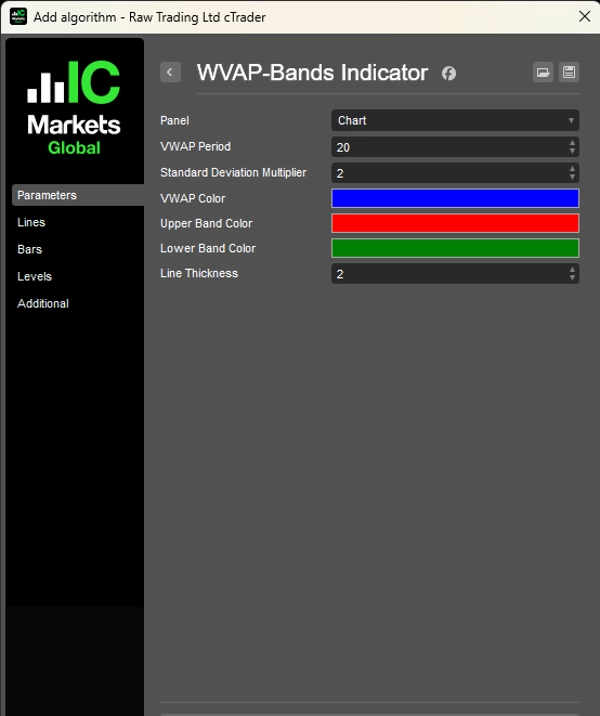
⚙️ การตั้งค่ามืออาชีพ
- ช่วงเวลา VWAP: 1-200 แท่ง (ค่าเริ่มต้น: 20)
- ส่วนเบี่ยงเบนมาตรฐาน: ตัวคูณ 0.1-5.0 (ค่าเริ่มต้น: 2.0)
- การปรับแต่งภาพ: สีและความหนาของเส้นที่กำหนดเอง
- หลายกรอบเวลา: ใช้งานได้กับทุกกรอบเวลาและเครื่องมือ
✅ ทำไมต้อง VWAP Bands?
เหนือกว่าค่าเฉลี่ยเคลื่อนที่ธรรมดา VWAP Bands มอบ:
- ความแม่นยำถ่วงน้ำหนักด้วยปริมาณ สำหรับการวิเคราะห์ระดับสถาบันที่แท้จริง
- แถบความผันผวนที่ปรับตัวได้ ที่ปรับตามสภาพตลาด
- วิธีการระดับมืออาชีพ ที่ใช้โดยเทรดเดอร์ที่ประสบความสำเร็จทั่วโลก
- การใช้งานสากล ครอบคลุมฟอเร็กซ์ หุ้น คริปโต และสินค้าโภคภัณฑ์
เหมาะสำหรับสแคปเปอร์ เทรดเดอร์รายวัน และเทรดเดอร์สวิงที่ต้องการการวิเคราะห์ปริมาณระดับมืออาชีพ
เข้ากันได้กับ cTrader 4.0+ ใช้งานได้กับทุกเครื่องมือและกรอบเวลา
สรุป
สรุปโดย AI
The WVAP-Bands Indicator provides volume-weighted average price (VWAP) analysis enhanced with dynamic standard deviation bands. It calculates VWAP using the HLC/3 price method and overlays upper and lower bands based on volume-weighted standard deviation, offering adaptive volatility measures. The indicator supports full customization of periods, colors, and band width multipliers, allowing traders to tailor it to their strategies. It updates in real time with each new bar, delivering immediate market insights.
Key trading applications include identifying overbought and oversold conditions (upper band signals sell, lower band signals buy), dynamic support and resistance levels with VWAP as an institutional reference, mean reversion opportunities when prices reach band extremes, and trend confirmation through breakouts beyond the bands. Settings allow adjustment of VWAP period (1–200 bars), standard deviation multiplier (0.1–5.0), and visual elements such as colors and line thickness.
The indicator is compatible with all timeframes and instruments, including forex, stocks, cryptocurrencies, commodities, and indices. It is designed for scalpers, day traders, and swing traders seeking professional-grade volume analysis and is compatible with cTrader 4.0 and above.
โปรไฟล์อินดิเคเตอร์
รีวิวจากลูกค้า
4.5
รีวิว: 2
5 | 50 % | |
4 | 50 % | |
3 | 0 % | |
2 | 0 % | |
1 | 0 % |
รีวิวจากลูกค้า
October 4, 2025
The sample size matters. The useful metric is POC and VWAP first, compare the result with 20 reactions, and only scale if 2 sessions still looks controlled.
October 3, 2025
I liked it more as a extra filter for volume based context than as something to follow blindly. Pressure is easier to read, and the final decision still feels like it belongs to the trader. The next review on it on value area.
การสนทนา
คำถามที่พบบ่อย
BTCUSD
Forex
Signal
Breakout
Indices
EURUSD
Commodities
GBPUSD
NZDUSD
Prop
Scalping
Crypto
Stocks
XAUUSD
NAS100
USDJPY
VWAP
ผลิตภัณฑ์ที่มีให้บริการผ่าน cTrader Store รวมถึงบอทการเทรด อินดิเคเตอร์ และปลั๊กอิน มีให้บริการโดยนักพัฒนาบุคคลที่สามและมีไว้เพื่อวัตถุประสงค์ในการเข้าถึงข้อมูลและทางเทคนิคเท่านั้น cTrader Store ไม่ใช่โบรกเกอร์และไม่ได้ให้คำแนะนำการลงทุน คำแนะนำส่วนบุคคล หรือการรับประกันผลการดำเนินงานในอนาคต
เพิ่มเติมจากผู้เขียนคนนี้


ราคา
ตั้งแต่ 15/01/2025
7
การขาย