
คำอธิบาย
โปรไฟล์ปริมาณเซสชัน HD
สิ่งที่ทำ
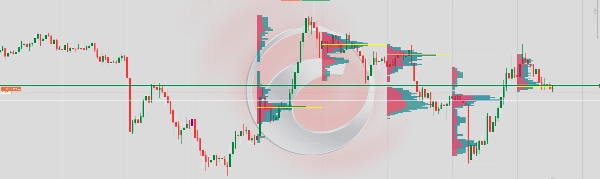
แสดงโปรไฟล์ปริมาณแนวนอนสำหรับแต่ละเซสชันการซื้อขายโดยตรงบนแผนภูมิ แสดงให้เห็นว่าปริมาณการซื้อขายกระจายอยู่ในระดับราคาอย่างไร ช่วยให้ผู้ซื้อขายระบุโซนกิจกรรมสูง พื้นที่มูลค่ายุติธรรม และระดับแนวรับ/แนวต้านที่สำคัญซึ่งได้มาจากพฤติกรรมปริมาณเท่านั้น
วิธีการทำงาน
เมื่อปิดแท่งใหม่แต่ละแท่ง ตัวบ่งชี้จะสแกนแท่งทั้งหมดภายในจำนวนเซสชันที่กำหนดและแจกจ่ายปริมาณติ๊กของแต่ละแท่งตามช่วงราคาของมัน ปริมาณจะแบ่งเป็น ฝั่งซื้อ (แท่งกระทิง) และ ฝั่งขาย (แท่งหมี) โดยใช้ทิศทางเปิด/ปิดของแท่งเป็นตัวแทน ผลลัพธ์จะแสดงเป็นฮิสโตแกรมแนวนอนแบบซ้อนกันที่ยึดติดกับขอบเขตเวลาของเซสชัน
องค์ประกอบภาพ
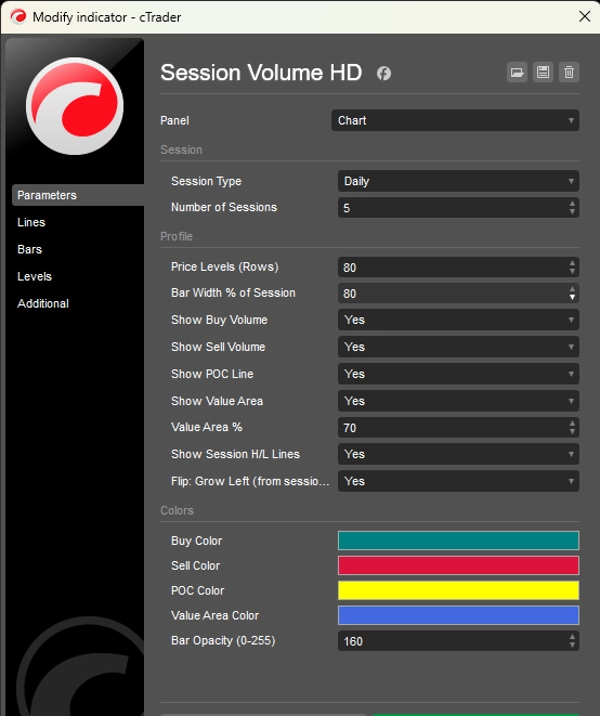
แท่งซื้อ (สีฟ้าเขียว) — แสดงปริมาณที่ซื้อขายในช่วงราคาขาขึ้นที่แต่ละระดับ เติบโตไปทางซ้าย (หรือขวาหากกลับด้าน) จากจุดยึดเซสชัน
แท่งขาย (สีแดง) — แสดงปริมาณที่ซื้อขายในช่วงราคาขาลงที่แต่ละระดับ ซ้อนกันข้างแท่งซื้อ
เส้น POC (สีเหลือง) — จุดควบคุม เส้นแนวนอนที่ทำเครื่องหมายระดับราคาที่มีปริมาณรวมสูงสุดในเซสชัน ทำหน้าที่เป็นแม่เหล็กราค
พื้นที่มูลค่า (ทับซ้อนสีน้ำเงิน) — ช่วงราคาที่มีเปอร์เซ็นต์ที่กำหนดได้ (ค่าเริ่มต้น 70%) ของปริมาณรวมในเซสชัน แสดงถึงโซน "มูลค่ายุติธรรม" ที่มีการซื้อขายส่วนใหญ่เกิดขึ้น
เส้นสูง/ต่ำของเซสชัน (จุดสีขาว) — ทำเครื่องหมายราคาสูงสุดและต่ำสุดที่ถึงในเซสชัน
ประสิทธิภาพ
ตัวบ่งชี้จะวาดใหม่ เพียงครั้งเดียวต่อแท่งใหม่ ไม่ใช่ทุกติ๊ก ซึ่งช่วยขจัดการกะพริบและรับประกันการแสดงผลที่เสถียรแม้มีหลายเซสชันและจำนวนระดับราคาสูง
ข้อจำกัด
เนื่องจาก cTrader ไม่เปิดเผยปริมาณเสนอซื้อ/เสนอขายจริงในระดับแท่งโดยไม่มีฟีดข้อมูลติ๊ก ปริมาณซื้อ/ขายจึง ประมาณค่า โดยใช้ทิศทางแท่ง: แท่งกระทิงน้ำหนัก 65% ซื้อ / 35% ขาย แท่งหมีตรงกันข้าม และแท่งโดจิแบ่ง 50/50 สำหรับปริมาณเดลต้าจริงจะต้องสมัครสมาชิกฟีดข้อมูลติ๊ก


