
Descrizione
Leggi il mercato in modo più intelligente con l'IA.
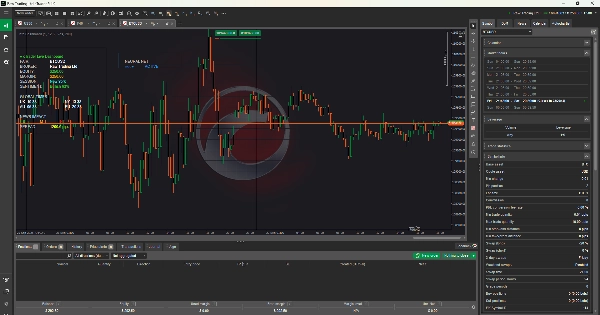
La Info Dashboard è il tuo compagno di trading tutto-in-uno, che combina reti neurali, analisi del sentiment e dati di mercato in tempo reale in un unico potente strumento.
✅ Insight della Rete Neurale AI – Rileva istantaneamente i modelli e prevedi i movimenti del mercato.
✅ Impatto di Notizie e Sentiment – Rimani avanti agli eventi che scuotono il mercato.
✅ Monitoraggio Equity e Saldo – Controlla la salute del tuo conto in tempo reale.
✅ Orologi dei Mercati Globali – Non perdere mai l'apertura o la chiusura di una sessione.
✅ Monitor della Forza della Coppia e dello Spread – Identifica le opportunità più forti.
Progettato per forex, crypto e indici, il dashboard ti offre chiarezza e velocità, trasformando dati complessi in segnali azionabili. Perfetto sia per trader nuovi che professionisti che vogliono un vantaggio sul mercato.
Con Info Dashboard, non segui solo i grafici—li comprendi.
Aggiorna il tuo trading oggi e vivi il futuro dell'analisi di mercato.
Riepilogo
Recensioni dei clienti
5 | 50 % | |
4 | 50 % | |
3 | 0 % | |
2 | 0 % | |
1 | 0 % |


