
ADXMultiframeIndicator
Indicatore
1 acquisti
Versione 1.0, Oct 2025
Windows, Mac
5.0
Recensioni: 2
Descrizione
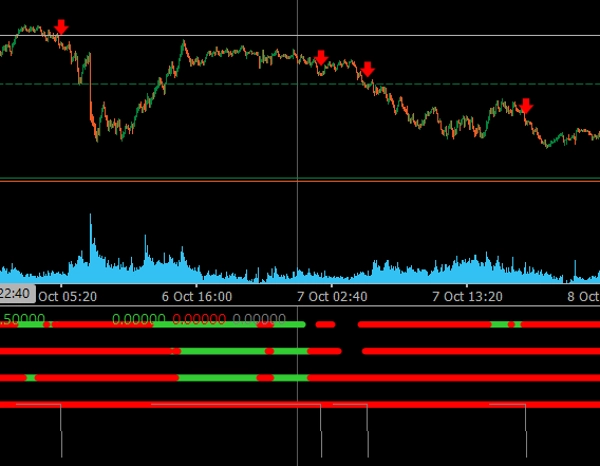
Il Multi-Timeframe ADX Trend Dots & Arrows è un indicatore di trading professionale per cTrader, progettato per identificare tendenze di mercato allineate su più timeframe utilizzando l'Average Directional Movement Index (ADX).
🔹 Caratteristiche principali:
- ✅ Analizza fino a 4 timeframe personalizzabili (M15, H1, H4, Daily).
- ✅ I puntini colorati mostrano la direzione del trend (Verde = Trend rialzista, Rosso = Trend ribassista).
- ✅ Le frecce automatiche appaiono quando tutti i timeframe sono allineati nella stessa direzione.
- ✅ Filtro barre consecutive riduce segnali falsi o prematuri.
- ✅ Visualizzazione pulita e moderna ottimizzata sia per temi scuri che chiari del grafico.
- ✅ Perfetto per individuare conferme multi-timeframe e punti di continuazione del trend.
Questo indicatore è ideale per i trader che vogliono vedere il quadro generale e entrare solo quando tutti i timeframe sono d'accordo, offrendo setup di trading più forti e affidabili.
Riepilogo
Riepilogo AI
The ADXMultiframeIndicator is a trading indicator for the cTrader platform that identifies market trends by analyzing the Average Directional Movement Index (ADX) across multiple timeframes. It supports up to four customizable timeframes, including M15, H1, H4, and Daily. The indicator displays colored dots to indicate directional bias—green for uptrends and red for downtrends—and automatically shows arrows when all selected timeframes align in the same direction. A consecutive bars filter is included to reduce false or premature signals. The visualization is designed to be clear and modern, compatible with both dark and light chart themes. This tool assists traders in confirming multi-timeframe trends and identifying trend continuation points by highlighting when all timeframes agree, facilitating more informed trade entries. It is particularly useful for analyzing indices markets.
Profilo indicatore
Recensioni dei clienti
5.0
Recensioni: 2
5 | 100 % | |
4 | 0 % | |
3 | 0 % | |
2 | 0 % | |
1 | 0 % |
Recensioni dei clienti
October 28, 2025
the first signal should not decide the only input, but it can look better than it is during a lucky run.
Discussioni
Domande frequenti
Indices
I prodotti disponibili tramite cTrader Store, inclusi bot di trading, indicatori e plugin, sono forniti da sviluppatori terzi e resi disponibili esclusivamente a scopo informativo e di accesso tecnico. cTrader Store non è un broker e non fornisce consulenze in materia di investimento, raccomandazioni individualizzate o garanzie di risultati futuri.
Altro da questo autore


Prezzo
Da 21/01/2025
3
Vendite