
RsiMultiFrameOBOS
Indicatore
Versione 1.0, Oct 2025
Windows, Mac
4.0
Recensioni: 1
Descrizione
Descrizione:
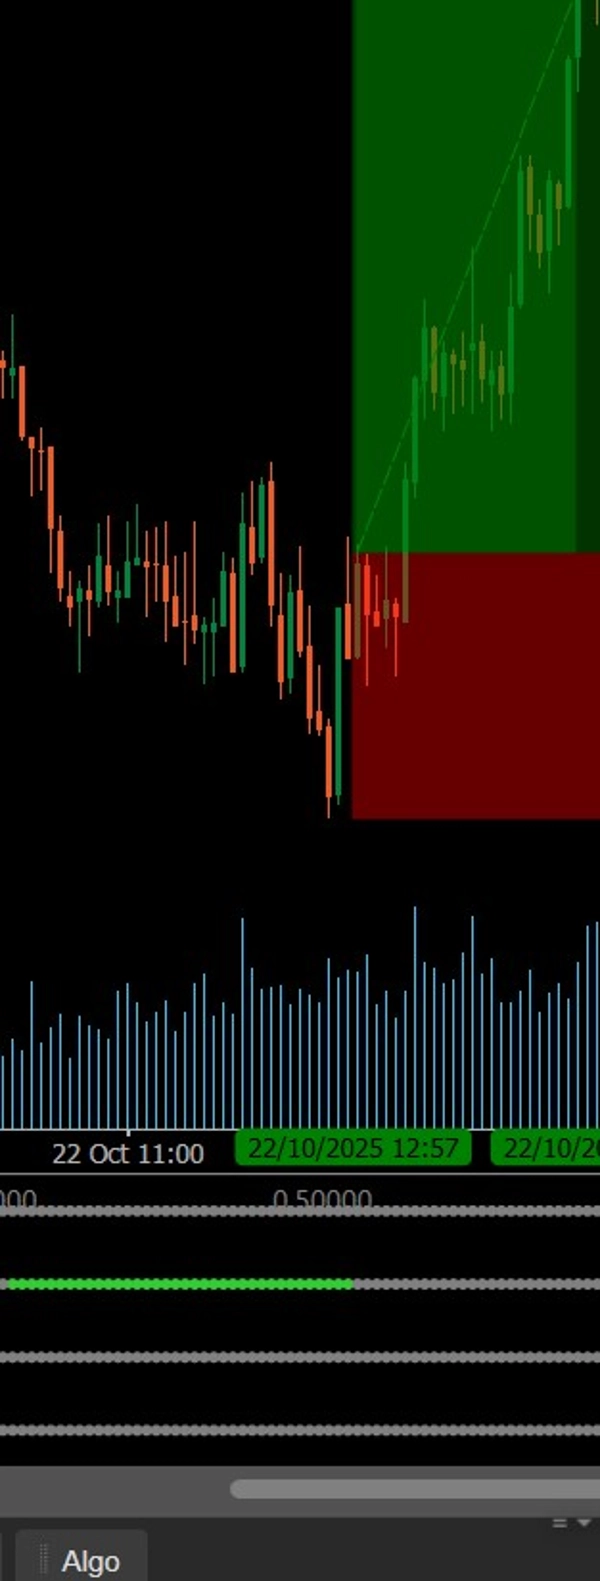
Questo indicatore visualizza le tendenze RSI su quattro intervalli di tempo personalizzabili utilizzando punti codificati a colori (verde per ipervenduto, rosso per ipercomprato, grigio per neutro). Aiuta i trader a valutare istantaneamente l'allineamento del momentum di mercato e a identificare conferme RSI multi-intervallo per ingressi più forti.
Riepilogo
Profilo indicatore
Recensioni dei clienti
4.0
Recensioni: 1
5 | 0 % | |
4 | 100 % | |
3 | 0 % | |
2 | 0 % | |
1 | 0 % |
Recensioni dei clienti
November 8, 2025
A few signals across sessions tell more, and the review screen feels calmer.
Discussioni
Domande frequenti
BTCUSD
Prop
Forex
Scalping
Indices
EURUSD
Commodities
RSI
Crypto
Stocks
XAUUSD
Martingale
I prodotti disponibili tramite cTrader Store, inclusi bot di trading, indicatori e plugin, sono forniti da sviluppatori terzi e resi disponibili esclusivamente a scopo informativo e di accesso tecnico. cTrader Store non è un broker e non fornisce consulenze in materia di investimento, raccomandazioni individualizzate o garanzie di risultati futuri.
Altro da questo autore


Prezzo
Da 21/01/2025
3
Vendite