
Descrizione
SmartFibonacci — ritracciamenti ed estensioni di Fibonacci automatici e configurabili con supporto per timeframe superiori, etichette di prezzo e avvisi di prossimità per decisioni di trading più rapide e sicure.
Descrizione breve pronta per lo store (1–2 righe)
SmartFibonacci rileva automaticamente i punti di swing high/low e disegna chiaramente i ritracciamenti di Fibonacci e le estensioni opzionali sul tuo grafico. Il lookback configurabile, il rilevamento swing su timeframe superiori, le etichette di prezzo/percentuale e gli avvisi di prossimità lo rendono ideale sia per scalping intraday che per setup swing.
Descrizione completa del prodotto (pronta per copia-incolla nel cTrader Store)
SmartFibonacci è un indicatore leggero e orientato alle prestazioni per cTrader che automatizza l'analisi di Fibonacci, così puoi dedicare meno tempo a tracciare i livelli e più tempo al trading. Individua lo swing high e low più recente all'interno di un lookback configurabile, disegna i livelli di ritracciamento e i livelli di proiezione (estensione) opzionali, e mostra etichette di prezzo e percentuale per una rapida interpretazione. Per segnali robusti, SmartFibonacci può calcolare i punti di swing su un timeframe superiore mentre disegna i livelli sul grafico corrente. Gli avvisi integrati (popup + suono) ti notificano quando il prezzo si avvicina entro una distanza configurabile in pip a qualsiasi livello di Fibonacci visibile.
Questa offerta include: screenshot chiari che mostrano gli elementi chiave dell'interfaccia utente, esempi di flussi di lavoro, impostazioni di configurazione e output di esempio (etichette di prezzo, estensioni, avvisi) per facilitare la valutazione della funzionalità e dell'esperienza utente prima dell'acquisto.
Caratteristiche principali
- Rilevamento swing automatico — trova lo swing high/low più recente all'interno di una finestra di lookback configurabile.
- Opzione swing su timeframe superiore — calcola i pivot di swing su un timeframe superiore per livelli più fluidi e significativi.
- Ritracciamenti ed estensioni — disegna linee di ritracciamento standard e livelli opzionali di proiezione (estensione) (percentuali definibili dall'utente come 127.2, 161.8, ecc.).
- Etichette di prezzo e percentuale — ogni livello visibile mostra la sua percentuale e il prezzo esatto per decisioni rapide.
- Aspetto personalizzabile — imposta colori (ritracciamento / estensione), spessore e stile delle linee.
- Avvisi di prossimità — popup + suono quando il prezzo entra in un raggio configurabile di pip da un livello di Fibonacci visibile; opzione per avvisare solo il livello più vicino.
- Logica di ridisegno efficiente — l'indicatore si ridisegna solo quando cambiano i pivot di swing per ridurre il disordine sul grafico e l'uso della CPU.
- Impostazioni predefinite sicure — valori predefiniti sensati per trader che vogliono un uso immediato dopo l'installazione.
- Compatibile con cTrader / cAlgo — progettato per funzionare come indicatore overlay.
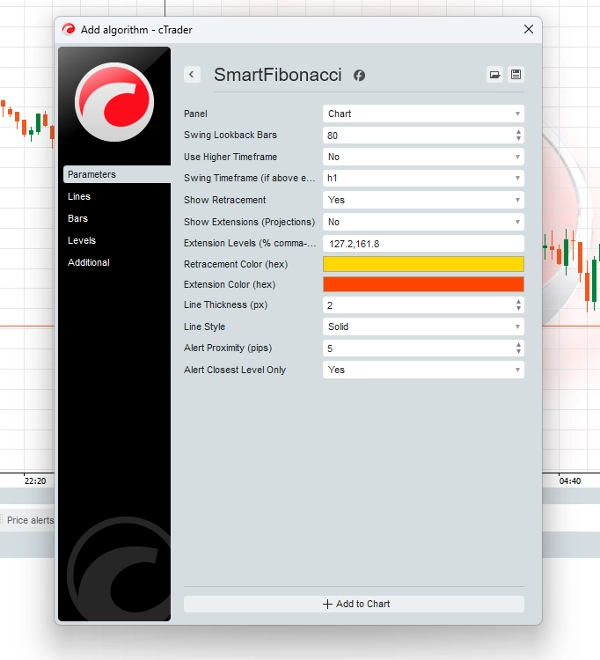
Configurazione (parametri e spiegazioni)
- Swing Lookback Bars (int) — quante barre cercare indietro per trovare swing high/low (default 80).
- Use Higher Timeframe (bool) — abilita il rilevamento su un timeframe superiore mentre si disegna sul grafico corrente.
- Swing Timeframe (TimeFrame) — il timeframe superiore da usare quando
Use Higher Timeframeè abilitato. - Show Retracement (bool) — attiva/disattiva il disegno dei livelli di ritracciamento.
- Show Extensions (bool) — attiva/disattiva il disegno dei livelli di estensione/proiezione.
- Extension Levels (string) — valori percentuali separati da virgola (es.,
127.2,161.8) usati per popolare le linee di proiezione. - Retracement Color / Extension Color (hex) — scegli i colori per le linee di ritracciamento e estensione.
- Line Thickness (px) — impostazione intera dello spessore della linea.
- Line Style (enum) — scegli solido, tratteggiato ecc.
- Alert Proximity (pips) — distanza in pips per gli avvisi di prossimità.
- Alert Closest Level Only (bool) — se abilitato, solo il livello fib più vicino attiva il popup.
Output analitici ed elementi UX
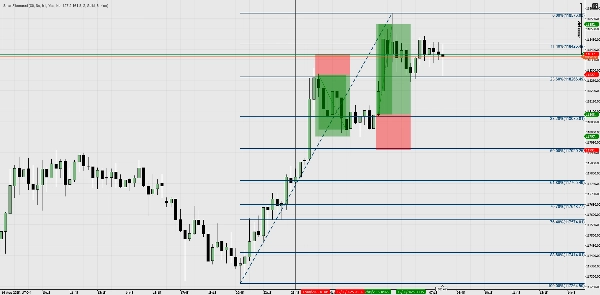
- Linee sul grafico — linee di ritracciamento ed estensione con chiare etichette percentuali (es., 61.8%) ed etichette di prezzo (es., 1.23456).
- Notifiche popup — l'utente riceve un popup a schermo e il suono di sistema quando il prezzo entra nell'area
Alert Proximity. - Ridisegni non invasivi — si aggiorna solo quando cambia lo swing rilevato per evitare frequenti sfarfallii di ridisegno.
- Coerenza della fonte prezzo — avvisi ed etichette sono calcolati usando la stessa serie di barre su cui è stato disegnato il fib (importante quando si usa il calcolo su timeframe superiore).
Esempi di flussi di lavoro / scenari d'uso
- Configurazione rapida (scalping / intraday)
-
- Applica SmartFibonacci a un grafico a 5 minuti, imposta
Lookback = 80,ShowRetrace = true. - Osserva i livelli di ritracciamento e usa 61.8% / 50% come zone di reazione intraday.
- Abilita
Alert Proximity = 5 pipsper ricevere notifiche quando il prezzo si avvicina a livelli importanti.
- Applica SmartFibonacci a un grafico a 5 minuti, imposta
- Contesto su timeframe superiore (swing trading)
-
- Imposta
Use Higher Timeframe = truee selezionaHigher Timeframe = H4(o Daily). - I livelli riflettono gli swing H4 mentre fai trading su H1 o M30 — migliore allineamento con la struttura del TF superiore.
- Usa le estensioni (127.2, 161.8) come target di profitto per i trade swing.
- Imposta
- Validazione + confluenza
-
- Combina i livelli di SmartFibonacci con i tuoi supporti/resistenze esistenti, rotture di struttura o medie mobili per convalidare gli ingressi.
- Usa gli avvisi popup per temporizzare gli ingressi o annota le interazioni per il backtesting.
- Flussi di lavoro guidati dagli avvisi
-
- Mantieni l'indicatore attivo mentre monitori più grafici; ricevi popup quando il prezzo si avvicina a qualsiasi livello fib visibile configurato e agisci di conseguenza.
Riepilogo
Recensioni dei clienti
5 | 100 % | |
4 | 0 % | |
3 | 0 % | |
2 | 0 % | |
1 | 0 % |


