Descrizione
🧠 Indicatore RSI Avanzato – Analisi di Momentum di Precisione
Ottieni una Comprensione Più Profonda delle Tendenze di Mercato con un RSI più Intelligente
L’Indicatore RSI Avanzato è un’evoluzione potente dello strumento RSI classico, sviluppato per trader che apprezzano la precisione e il filtraggio intelligente dei segnali. Con una levigatura algoritmica avanzata, zone adattive e rilevamento integrato delle divergenze, questo strumento offre un’analisi del momentum raffinata per tutti i mercati e timeframe.
🔍 Caratteristiche Principali:
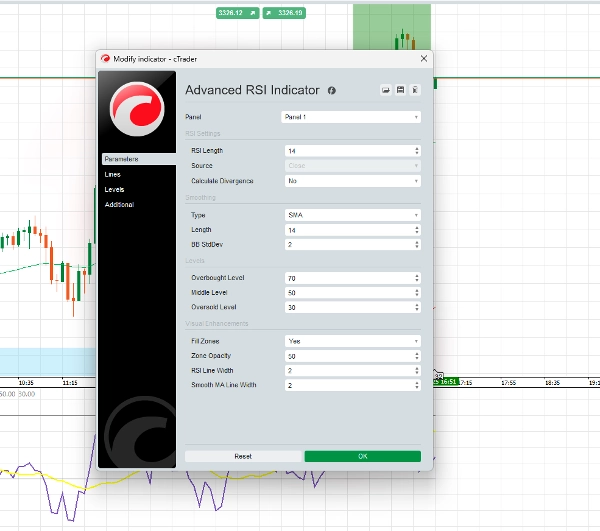
✅ Curva RSI Levigata
Riduce i movimenti irregolari e i falsi segnali per una visione più chiara delle tendenze di mercato.
✅ Zone di Segnale Adattive
Va oltre i tradizionali livelli 70/30 con soglie dinamiche che rispondono alla volatilità del mercato.
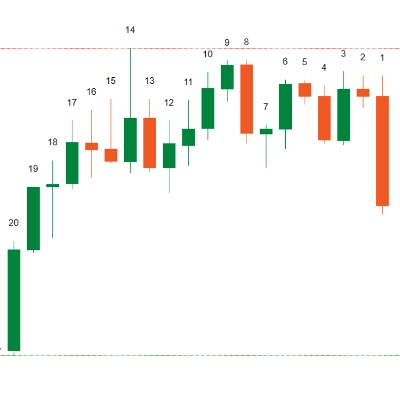
✅ Zone di Momentum Codificate a Colori
Valuta rapidamente il momentum rialzista o ribassista con un design visivo intuitivo.
✅ Avvisi di Divergenza
Evidenzia configurazioni di divergenza rialzista e ribassista per supportare decisioni strategiche.
✅ Sistema di Avvisi Personalizzato
Imposta avvisi per attraversamenti di livelli RSI e segnali di divergenza così da non perdere mai i momenti chiave.
✅ Multi-Asset, Multi-Timeframe
Ottimizzato per l’uso su forex, crypto, azioni, indici e altro — da M1 a grafici giornalieri.
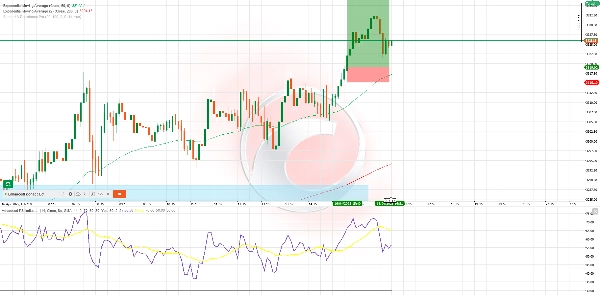
⚙️ Esempio di Strategia – RSI Wave Ride
Ideale per: swing trade H1 & H4
Indicatori utilizzati: RSI Avanzato, 50 EMA, 200 EMA
Esempio di Acquisto:
- Il prezzo è sopra le EMA 50 & 200
- L’RSI scende sotto 40 e inizia a salire
- Compare il colore del momentum rialzista
- (Opzionale) Divergenza rialzista rilevata
- Entrata: chiusura della candela sopra il segnale
- SL: sotto l’ultimo minimo dello swing
- TP: 1,5x–2x il rischio o resistenza recente
Esempio di Vendita:
- Il prezzo è sotto le EMA 50 & 200
- L’RSI supera 60, poi inizia a scendere
- Il colore del momentum ribassista conferma la direzione
- (Opzionale) Divergenza ribassista rafforza il segnale
- Entrata: chiusura candela di conferma
- SL: sopra l’ultimo massimo dello swing
- TP: 1,5x–2x il rischio o supporto recente
💬 Perché i Trader Scelgono Questo Strumento:
- Facile da usare, ma potente
- Segnali non ridipinti
- Testato sui principali mercati
- Può essere usato da solo o insieme ad altre strategie
Riepilogo
Recensioni dei clienti
5 | 100 % | |
4 | 0 % | |
3 | 0 % | |
2 | 0 % | |
1 | 0 % |