Descrizione
Indicatore robusto di delta cumulativo e squilibrio.
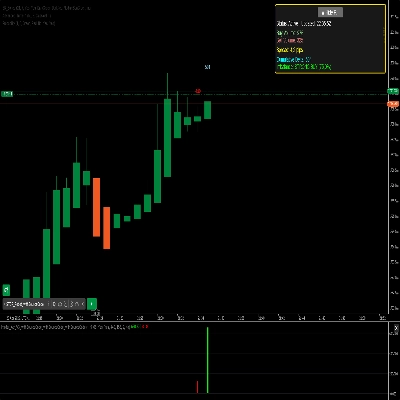
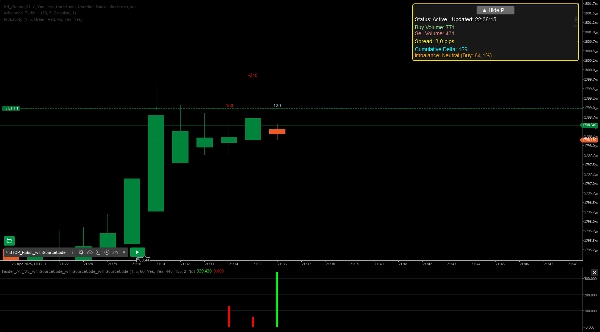
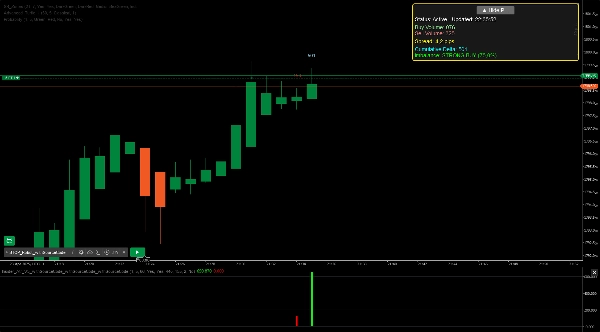
Insider è un indicatore cTrader robusto progettato per analizzare i dati della profondità di mercato e evidenziare squilibri di acquisto e vendita in tempo reale. Fornisce un feedback visivo chiaro sul grafico, mostrando metriche chiave come volume di acquisto/vendita, delta cumulativo e forza dello squilibrio tramite istogrammi e una dashboard personalizzabile. Personalizzalo in base al tuo stile di trading con impostazioni regolabili, inclusi il periodo di visualizzazione, i livelli di profondità (1-10) e la soglia di squilibrio del volume (50-95%). Le funzionalità aggiuntive includono avvisi opzionali per squilibri forti, filtro per orari di trading e un pannello ridimensionabile per una migliore usabilità. Ideale per day trader e swing trader, questo indicatore offre preziose informazioni sul sentiment di mercato e sui potenziali movimenti di prezzo.
Riepilogo
Recensioni dei clienti
5 | 100 % | |
4 | 0 % | |
3 | 0 % | |
2 | 0 % | |
1 | 0 % |