
Descrizione
Proiezione Dinamica del Prezzo 📈🔮
https://chartshots.spotware.com/c/69d5304ea1cc1
Cos'è?
https://chartshots.spotware.com/c/69d52fb4b01cd
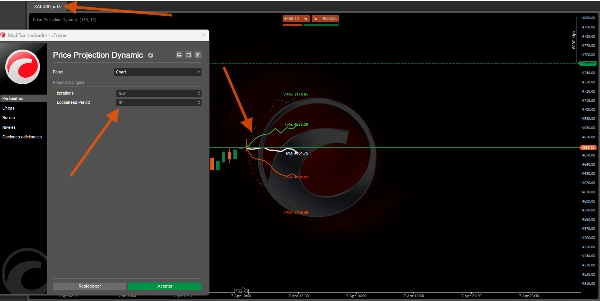
Proiezione Dinamica del Prezzo è un indicatore sovrapposto che proietta percorsi futuri del prezzo statisticamente probabili utilizzando la simulazione Monte Carlo e valuta il bias direzionale tramite un classificatore di probabilità bayesiano. Risponde a una domanda: dato come si è mosso questo asset, dove è statisticamente probabile che vada dopo? 📊
https://chartshots.spotware.com/c/69d53010d38ce
Come Funziona ⚙️
Motore 1 — Proiezione Monte Carlo 🎲
L'indicatore analizza la storia recente dei prezzi ed estrae rendimenti logaritmici. Calcola il rendimento medio e la sua deviazione standard — catturando sia il drift (tendenza) sia la volatilità (movimento erratico) 🌪️.
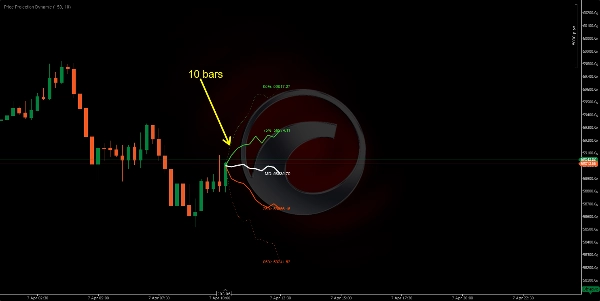
Esegue 200 percorsi di prezzo simulati (fino a 500) nel futuro. Ogni simulazione è una "passeggiata casuale" basata sull'azione reale recente. Da questi, l'indicatore estrae 5 bande percentile:
Banda
Significato
95%
Estremo ottimista — solo il 5% delle simulazioni è andato più in alto 🚀
75%
Intervallo probabile superiore — il prezzo è finito sopra questo nel 25% delle simulazioni 📈
50% (MD)
Proiezione mediana — il centro statistico di tutti i risultati 🎯
25%
Intervallo probabile inferiore — il prezzo è finito sotto questo nel 25% delle simulazioni 📉
05%
Estremo pessimista — solo il 5% delle simulazioni è andato più in basso 📉🛑
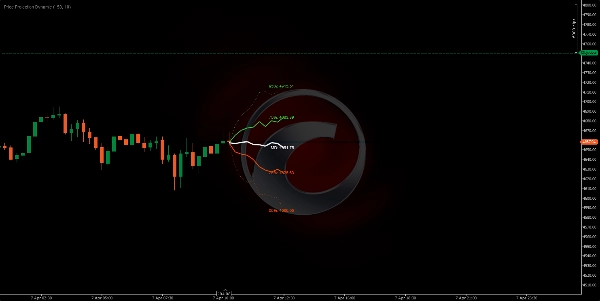
Consiglio Pro: Più il ventaglio si apre, maggiore è la volatilità attuale 📢. Un ventaglio stretto significa che l'asset si muove in modo prevedibile 🧵.
Motore 2 — Classificatore Bayesiano 🧠
Indipendente dalla proiezione, questo motore classifica il mercato come rialzista o ribassista tramite:
- Analisi retrospettiva su una finestra (default 500 barre) 🔍.
- Misurazione del volume relativo e del momentum per barre rialziste vs. ribassiste.
- Calcolo di quale profilo la barra corrente si adatta meglio usando la probabilità gaussiana ⚖️.
Il risultato è una percentuale di probabilità di vittoria:
Probabilità
Interpretazione
> 70%
Alta fiducia rialzista ✅🟢
50–70%
Moderata / incerta ⚖️🟡
< 30%
Alta fiducia ribassista ✅🔴
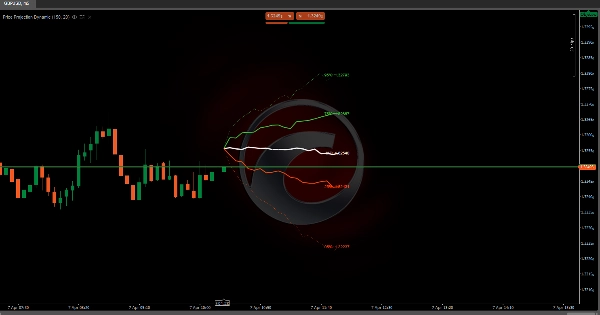
Elementi Visivi 🎨
- Linee verdi (75%, 95%): Bande di proiezione superiori — intervallo rialzista 🍏
- Linea bianca (MD): Prezzo mediano proiettato — percorso più probabile 🏁
- Linee arancioni (25%, 05%): Bande di proiezione inferiori — intervallo ribassista 🍊
- Linee esterne tratteggiate: Estremi 95% e 05% (confini a bassa probabilità) ⚠️
- Linee interne continue: 75%, 50%, 25% (zona ad alta probabilità) ✅
- Etichette di prezzo: Prezzo proiettato esatto per ogni percentile 🏷️
- Pannello informazioni (in alto a destra): Probabilità di vittoria bayesiana, obiettivo mediano, volume relativo, direzione del segnale 🖥️
Come Usarlo 📖
- Leggi la forma del ventaglio 📢 — Se si espande rapidamente, la volatilità è alta e le proiezioni sono meno certe.
- Usa la linea mediana (MD) 🎯 come obiettivo di prezzo futuro statisticamente più probabile.
- Usa le bande 75%/25% 📏 come obiettivi realistici superiori/inferiori per le operazioni.
- Usa le bande 95%/05% 🛑 come confini estremi — utili per il posizionamento dello stop loss.
- Controlla il pannello bayesiano 🧠 — Una probabilità sopra il 70% o sotto il 30% aggiunge convinzione direzionale.
- Combina entrambi i motori 🤝 — Se la linea mediana è inclinata verso l'alto E la probabilità bayesiana è > 70%, il setup è statisticamente forte.
Parametri Chiave ⚙️
Parametro
Cosa Controlla
Valore Maggiore
Valore Minore
Iterazioni
Numero di percorsi simulati
Bande più fluide 🌊
Calcolo più veloce ⚡
Lookahead
Distanza della proiezione futura
Orizzonte più lungo 🔭
Più breve, più affidabile 🔍
Profondità del Campione
Barre recenti da analizzare
Comportamento a lungo termine 🐢
Solo comportamento recente 🐇
Finestra del Classificatore
Storia bayesiana
Probabilità più stabile ⚖️
Più reattiva ⚡
Profilo dell'Indicatore 📋
- Categoria dell'indicatore: Statistiche 📊
- Tipo di output: Visualizzazione & Segnali 🖼️
- Requisiti dati: Solo barre 📶
Disclaimer ⚠️
Questo indicatore proietta probabilità statistiche, non previsioni 🔮. Le simulazioni Monte Carlo assumono che il futuro sarà simile al passato recente — questo viene meno durante eventi cigno nero 🦢 o gap causati da notizie. Usalo come un quadro probabilistico insieme alla tua gestione del rischio 🛡️.
Riepilogo
Separately, the Bayesian classifier evaluates market sentiment by analyzing relative volume and momentum over a configurable window, providing a win probability percentage that indicates bullish or bearish confidence. Visual elements include color-coded projection bands (green for bullish, orange for bearish), a median price line, price labels for each percentile, and an info panel displaying Bayesian probability and other metrics.
Key adjustable parameters include the number of simulation iterations, projection horizon, sample depth of historical bars, and classifier window size. The indicator requires bar data with volume and outputs visual projections and directional signals. It is designed to offer a probabilistic framework for anticipating price movement based on recent market behavior, suitable for various symbols including BTCUSD, EURUSD, GBPUSD, XAUUSD, NAS100, and others.
Recensioni dei clienti
5 | 0 % | |
4 | 100 % | |
3 | 0 % | |
2 | 0 % | |
1 | 0 % |


![Logo di "[Stellar Strategies] Market Session Ultimate"](https://cdn.ctrader.com/image/webp/61ffd537-0125-4246-9e72-42eca1791d64_28232)


