
PriceLevels
Indicatore
4 acquisti
Versione 1.0, Jan 2025
Windows, Mac
5.0
Recensioni: 2
Descrizione
Caratteristiche principali:
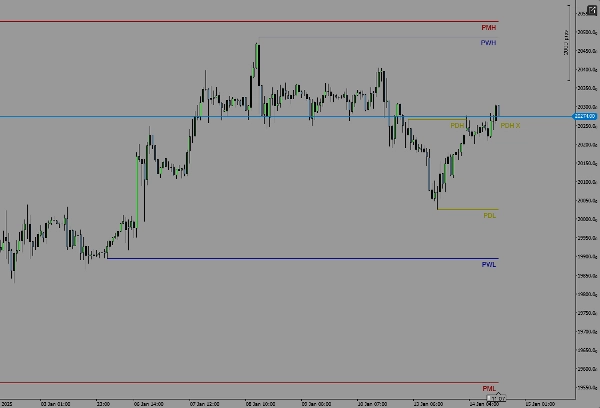
- Mostra i livelli massimi e minimi di ieri.
- Mostra i livelli massimi e minimi della scorsa settimana.
- Mostra i livelli massimi e minimi del mese scorso.
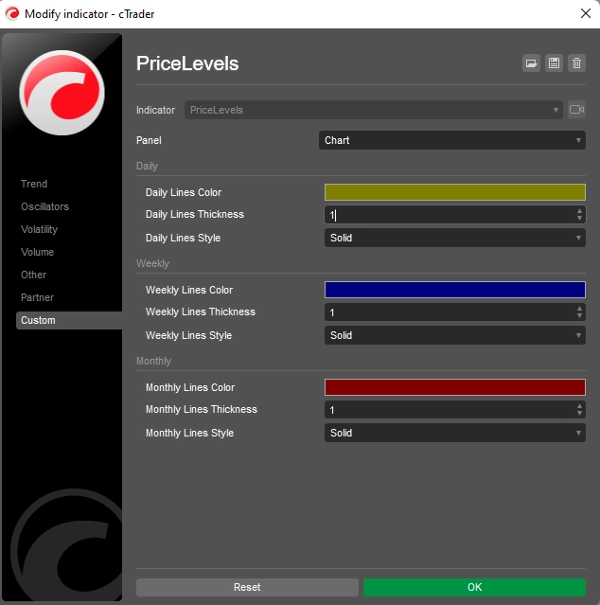
- Colori e stili di linea personalizzabili per ogni livello.
Come funziona:
L'indicatore calcola automaticamente i prezzi più alti e più bassi del giorno, della settimana e del mese precedenti in base al timeframe del tuo grafico. Questi livelli vengono quindi tracciati come linee orizzontali sul tuo grafico, fornendo un chiaro riferimento visivo per l'azione del prezzo storica.
Compatibilità:
- Progettato solo per la piattaforma cTrader.
- Funziona su tutti i timeframe e strumenti.
Se hai domande, feedback o suggerimenti per miglioramenti, non esitare a contattarci! Il tuo contributo è molto apprezzato e aiuterà a rendere questo indicatore ancora migliore.
Buon trading!
Riepilogo
Riepilogo AI
PriceLevels is an indicator designed for the cTrader platform that automatically calculates and displays key historical price levels on trading charts. It plots the highest and lowest prices from the previous day, last week, and last month as horizontal lines, providing traders with clear visual references for past price action. The indicator supports all timeframes and instruments available on cTrader. Users can customize the colors and line styles for each displayed level to suit their charting preferences. This tool aids in identifying significant support and resistance zones based on recent historical data.
Profilo indicatore
Recensioni dei clienti
5.0
Recensioni: 2
5 | 100 % | |
4 | 0 % | |
3 | 0 % | |
2 | 0 % | |
1 | 0 % |
Discussioni
Domande frequenti
I prodotti disponibili tramite cTrader Store, inclusi bot di trading, indicatori e plugin, sono forniti da sviluppatori terzi e resi disponibili esclusivamente a scopo informativo e di accesso tecnico. cTrader Store non è un broker e non fornisce consulenze in materia di investimento, raccomandazioni individualizzate o garanzie di risultati futuri.


Prezzo
Da 05/01/2025
14
Vendite