
Descrizione
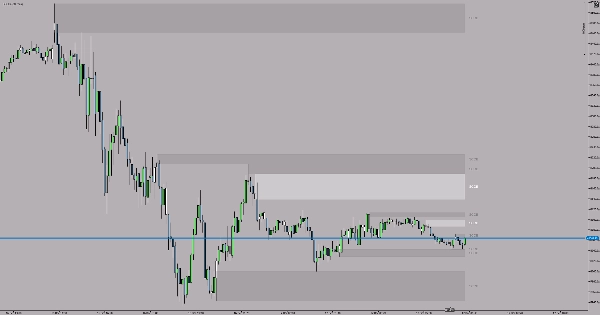
L'indicatore SCOB (Single Candle Order Block) identifica automaticamente e evidenzia potenti modelli di blocchi d'ordine sul tuo grafico. Questo strumento semplice ma efficace aiuta i trader a individuare modelli chiave di inversione che spesso indicano una forte attività istituzionale.
Cos'è un SCOB?
Un SCOB è un modello di tre candele che rivela potenziali zone di inversione:
SCOB rialzista:
- La 2ª candela fa un minimo più basso rispetto alla 3ª candela
- Il minimo della 1ª candela rimane sopra il minimo della 2ª candela
- La 1ª candela chiude sopra il massimo della 2ª candela
- La 2ª candela è evidenziata come potenziale zona di supporto
SCOB ribassista:
- La 2ª candela fa un massimo più alto rispetto alla 3ª candela
- Il massimo della 1ª candela rimane sotto il massimo della 2ª candela
- La 1ª candela chiude sotto il minimo della 2ª candela
- La 2ª candela è evidenziata come potenziale zona di resistenza
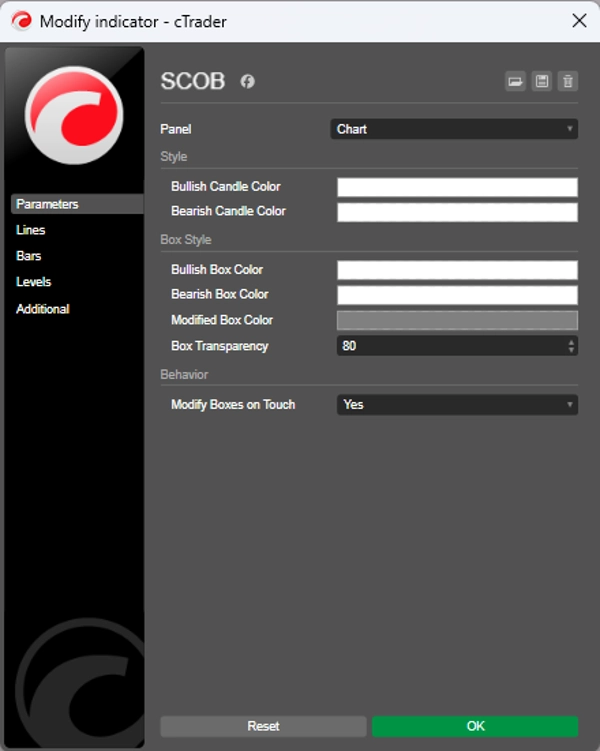
Impostazioni
Colore candela rialzista - Scegli il colore di evidenziazione per i modelli SCOB rialzisti (Predefinito: Bianco)
Colore candela ribassista - Scegli il colore di evidenziazione per i modelli SCOB ribassisti (Predefinito: Giallo)
Consigli per l'uso
- Usa i modelli SCOB per identificare potenziali zone di ingresso
- Combina con altri strumenti di analisi tecnica per conferma
- La candela evidenziata rappresenta un livello istituzionale chiave
- Operare sempre con il trend per setup a probabilità più alta
- Può essere utilizzato su qualsiasi timeframe in base alla tua strategia di trading
- Buona pratica: Segna i modelli SCOB su timeframe più alti (H1, H4, Daily) e opera nella direzione del trend.
Riepilogo
Profilo indicatore
Recensioni dei clienti
4.5
Recensioni: 2
5 | 50 % | |
4 | 50 % | |
3 | 0 % | |
2 | 0 % | |
1 | 0 % |
Recensioni dei clienti
October 3, 2025
Helps more when the trader avoids forced trades. It should not replace the chart.
Discussioni
Domande frequenti
BTCUSD
Forex
Indices
EURUSD
Commodities
GBPUSD
Prop
Scalping
SMC
Crypto
Stocks
XAUUSD
NAS100
USDJPY
I prodotti disponibili tramite cTrader Store, inclusi bot di trading, indicatori e plugin, sono forniti da sviluppatori terzi e resi disponibili esclusivamente a scopo informativo e di accesso tecnico. cTrader Store non è un broker e non fornisce consulenze in materia di investimento, raccomandazioni individualizzate o garanzie di risultati futuri.


Prezzo
Da 05/01/2025
14
Vendite