
Supertrend - Multi-Timeframe
Indicatore
1 acquisti
Versione 1.0, Oct 2025
Windows, Mac
4.5
Recensioni: 2
Descrizione
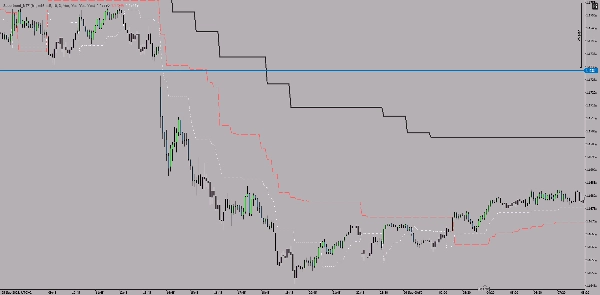
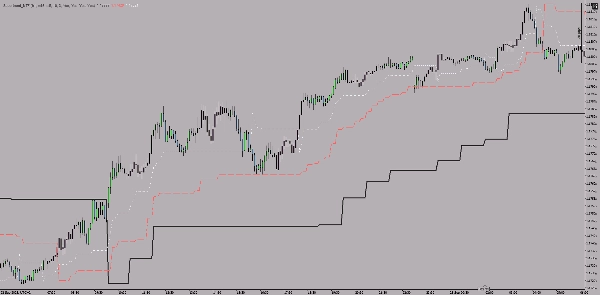
Questo è un indicatore Supertrend Multi-TimeFrame per la piattaforma cTrader che mostra simultaneamente le linee Supertrend di tre diversi intervalli di tempo su un unico grafico.
Caratteristiche principali
Visualizzazione parallela su tre timeframe:
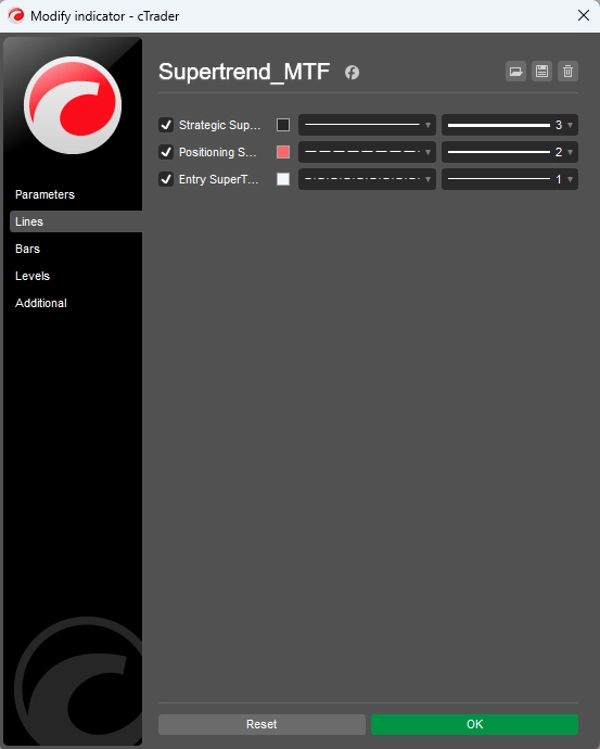
- Timeframe strategico (predefinito: 1 ora) - linea spessa e continua
- Timeframe di posizionamento (predefinito: 15 minuti) - linea di spessore medio, tratteggiata
- Timeframe di ingresso (predefinito: 5 minuti) - linea sottile, punteggiata
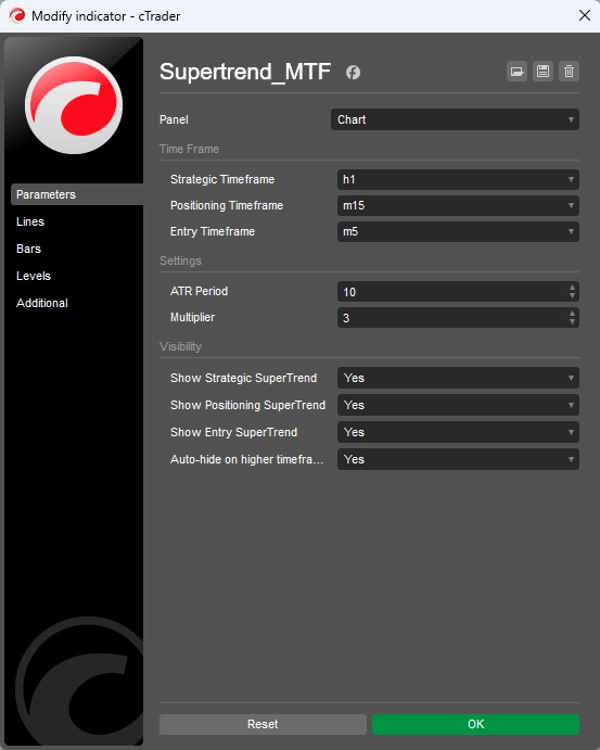
Impostazioni personalizzabili:
- Periodo ATR (predefinito: 10)
- Moltiplicatore (predefinito: 3.0)
- Ognuno dei tre timeframe può essere abilitato/disabilitato individualmente
- Nascondi automaticamente su timeframe più alti (opzionale)
Come funziona
L'indicatore utilizza la logica classica del Supertrend per tutti e tre i timeframe, dove:
- Il trend è rialzista quando il prezzo è sopra la linea Supertrend
- Il trend è ribassista quando il prezzo è sotto la linea Supertrend
- Diversi spessori e stili di linea aiutano a distinguere tra i timeframe
Scopo
Aiuta nell'analisi multi-timeframe: il timeframe più grande fornisce la direzione principale (strategia), quello intermedio affina il posizionamento e il più piccolo indica punti specifici di ingresso.
Riepilogo
Riepilogo AI
The Supertrend - Multi-Timeframe Indicator for the cTrader platform displays Supertrend lines from three distinct timeframes simultaneously on a single chart. It features a strategic timeframe (default 1 hour) shown as a thick solid line, a positioning timeframe (default 15 minutes) as a medium dashed line, and an entry timeframe (default 5 minutes) as a thin dotted line. Each timeframe can be individually enabled or disabled, with customizable settings including ATR period and multiplier. The indicator applies classic Supertrend logic: the trend is considered up when the price is above the Supertrend line and down when below. Different line styles and thicknesses visually distinguish the timeframes. This tool supports multi-timeframe analysis by providing the main directional trend from the larger timeframe, refined positioning from the middle timeframe, and specific entry points from the smallest timeframe. It is applicable across various markets including Forex, indices, commodities, stocks, and cryptocurrencies, and supports symbols such as BTCUSD, EURUSD, GBPUSD, XAUUSD, NAS100, and USDJPY.
Profilo indicatore
Recensioni dei clienti
4.5
Recensioni: 2
5 | 50 % | |
4 | 50 % | |
3 | 0 % | |
2 | 0 % | |
1 | 0 % |
Recensioni dei clienti
October 13, 2025
The part worth keeping is the setup needs a cleaner reason to exist, and a few ugly trades are useful in the sample.
October 10, 2025
Discussioni
Domande frequenti
BTCUSD
Forex
Breakout
Indices
EURUSD
Commodities
GBPUSD
NZDUSD
Prop
Scalping
Crypto
Stocks
XAUUSD
NAS100
USDJPY
I prodotti disponibili tramite cTrader Store, inclusi bot di trading, indicatori e plugin, sono forniti da sviluppatori terzi e resi disponibili esclusivamente a scopo informativo e di accesso tecnico. cTrader Store non è un broker e non fornisce consulenze in materia di investimento, raccomandazioni individualizzate o garanzie di risultati futuri.


![Logo di "[Stellar Strategies] Inside Bar with Signals"](https://cdn.ctrader.com/image/webp/1d9e8bfa-3b2c-4440-bb37-5856902008a7_30683)


Prezzo
Da 05/01/2025
14
Vendite