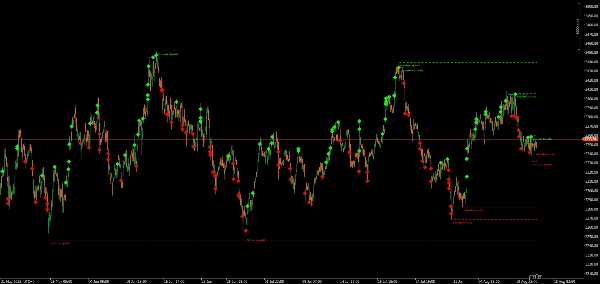
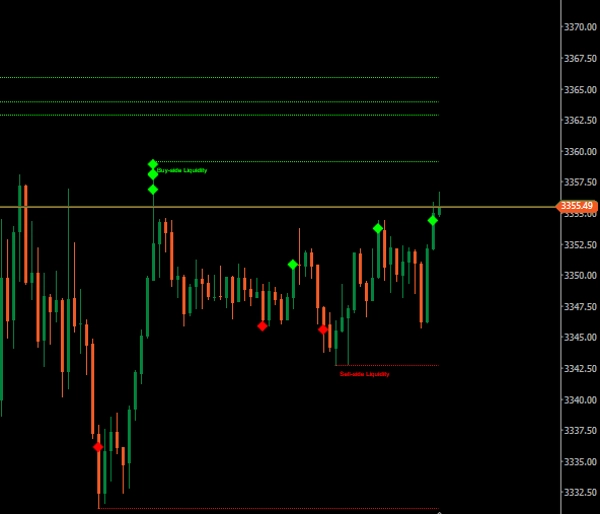
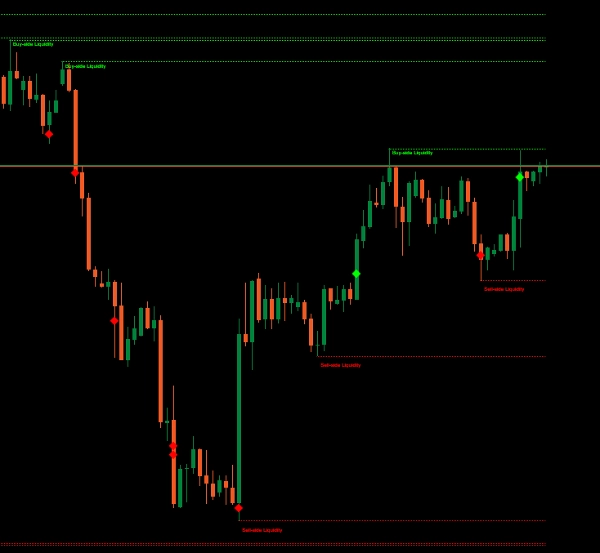
Logo di "BSL_SSL_Liqudity"
BSL_SSL_Liqudity
0.0
21/08/2025
1
Desktop

The Buy-Side & Sell-Side Liquidity (BSL/SSL) Indicator is designed for traders who follow institutional trading concepts (ICT) or liquidity-based strategies. It automatically detects key liquidity zones in the market—highlighting swing highs (Buy-Side Liquidity) and swing lows (Sell-Side Liquidity)—and monitors whether these levels have been swept or remain intact.

  1. BSL (Buy-Side Liquidity) – Marks recent swing highs where stop-loss orders from short positions or breakout buy orders may be clustered.
  2. SSL (Sell-Side Liquidity) – Marks recent swing lows where stop-loss orders from long positions or breakout sell orders may be sitting.
  3. Swept Markers – When price breaches a marked liquidity level, the indicator plots a diamond marker to show the sweep.

Who Is It For?

  • ICT Methodology Traders
  • Liquidity Grab / Stop Hunt Strategists
  • Scalpers & Day Traders targeting session-based moves
  • Swing Traders looking for high-probability reversal points

Benefits

  • Visual clarity – Instantly see where the market is likely to seek liquidity.
  • Time efficiency – No more manually marking swings and checking for sweeps.


  • Strategic advantage – Combine with
  • FVGs,
  • market structure to refine trade setups.
  • Session kill zones
  • macros


My Other Products


Disclaimer: Trading involves risk, and past results do not guarantee future performance. Use proper risk management, follow stop-loss levels, and trade responsibly. I am not liable for any financial losses from using these algorithms.use these indicators for your confluence and reduce burden your charting markup time

More from this author
Tiny_Aim_Trainer
trading stress-relief “mini-game”
MARKET_STRUCTURE BOS_CHoCH
MarketStructurePro – Smart BOS/CHoCH
Institutional FVG Zones MTF with Confluence
Professional Fair Value Gaps with multitimeframe spot on
Multi_TF Candlestick Chart Overlay
Perfect for traders who demand a clear overview of multiple timeframes at a glance.
Indicatore
breakout
vwap
scalping
VWAP & Sessions & D,W,M HLO Levels
Killzone Session With VWAP – Precision Meets Price Action
Market_Session_Forex
Market Sessions
ICT Killzones & Macros
KILLZONES AND MACRO SESSIONS
ICT_SMC_ToolKit
institutional-level market analysis
VWAP_MTF
📊 VWAP with MTF & Dynamic Deviation Bands
All-in-One Session Levels Suite
Institutional Session Levels Pro OHLC,Prev(D,W,M OHLC)
TDI_Pro
Traders Dynamic Index (TDI) — Divergence Edition
Potrebbe interessarti anche
BWMFI_Visual
BW_MFI Vizual colors bars
KDJ
The KDJ oscillator display consists of 3 lines (K, D and J - hence the name of the display) and 2 levels.
BoS CHoCH
BoS and ChoCh are useful for detecting Market structural points.
vpdi
VPDI (open, close, high and low with % of the previous day and price changes in % of the previous day's close)
EKVWAP
This is an advanced VWAP indicator (Anchored or non-Anchored) that allows you to customize all the aspects of it.
MAMA CANDLES
This code implements the MESA Adaptive Moving Average (MAMA) indicator, it creates candles based on MAMA calculations.
VolumeColorBar
Color Volume Bars – Visualize Market Strength Instantly
Larry Williams 9.1
Larry Williams 9.1
Time zone pro
FREE Global Trading Sessions Indicator
HAIQuantum-V10
The HAI Quantum V10 is an advanced indicator designed for technical analysis
Time To Break Even Indicator v2
Time To Break Even Indicator. This indicator helps you time your trade's entry.
Indicatore
forex
stocks
VegaXLR - Unlimited Trendline Alerts
This is an indicator that can alert you about trendlines, horizontal lines and vertical lines.
Indicatore
breakout
eurusd
supertrend
+1
Momentum Fair Value Gap
It identifies areas of market imbalance (Fair Value Gaps or FVGs) and projects them on the chart in a smart way
Indicatore
forex
prop
indices
+3
OBScope
A cutting-edge indicator designed to detect and visualize high-probability zones based on swing highs, swing lows.
Indicatore
usdjpy
signal
On Balance Volume USD - Combined
See USD demand in one line—Composite OBV fuses six major FX pairs into a clear momentum gauge.
MTF Candle Window - On Chart
The Multi-Timeframe Candle Indicator displays candles from multiple timeframes in one window, enhancing market analysis!
Alpha Sentiment Pro
Alpha Sentiment Pro - See the Market's Pulse Before It Moves
Market Polarity Zones
implifies market analysis by automatically identifying bullish 🚀 or bearish 🐻 phases and marking key levels where ....