
MACDVolume
Gösterge
19 satın almalar
Sürüm 1.0, Dec 2024
Windows, Mac
5.0
Değerlendirmeler: 3

Açıklama
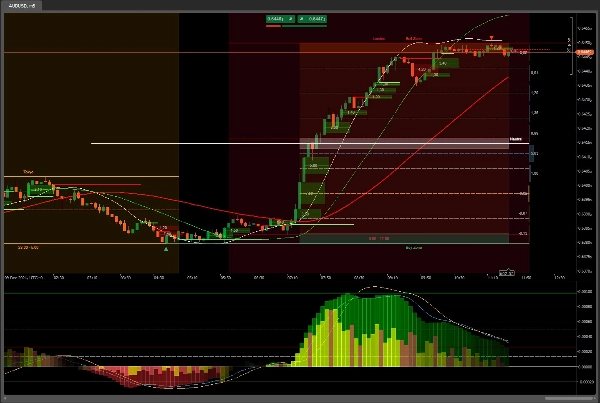
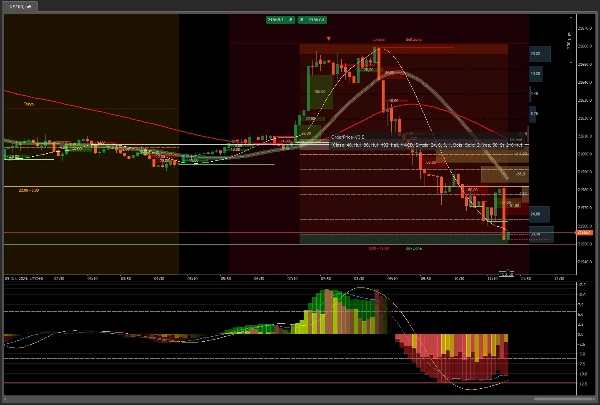
Dinamik Renk Değişimi ve Hacim ile Gelişmiş MACD Göstergesi
Açıklama: Gelişmiş MACD Göstergemiz sadece basit bir histogram değildir. Bu gösterge, ciddi her tüccar için vazgeçilmez kılan benzersiz özelliklerle piyasa trendlerinin net ve dinamik bir görünümünü sağlamak üzere tasarlanmıştır.
Ana Özellikler:
- Dinamik Renk Değişimi:
-
- Pozitif: Değerler arttıkça histogram yeşilden beyaza değişir, yükseliş trendlerinin net bir görselleştirilmesini sağlar.
- Negatif: Değerler azaldıkça histogram kırmızıdan beyaza değişir, düşüş trendlerini vurgular.
- Hacim Göstergesi:
-
- Pozitif Hacim: Yeşil çubuklarla temsil edilir, işlem hacminde artışı gösterir.
- Negatif Hacim: Kırmızı çubuklarla temsil edilir, işlem hacminde azalmayı gösterir.
- Net Görselleştirme: Hacim çubuklarındaki renk kombinasyonu (yeşil, sarı, kahverengi, kırmızı) piyasa alım ve satım faaliyetlerinin net bir görünümünü sağlar.
- Otomatik Yakınlaştırma:
-
- Göstergeyi merkezde tutar ve manuel ayarlama gerektirmeden optimal görüntüleme için otomatik olarak ayarlar.
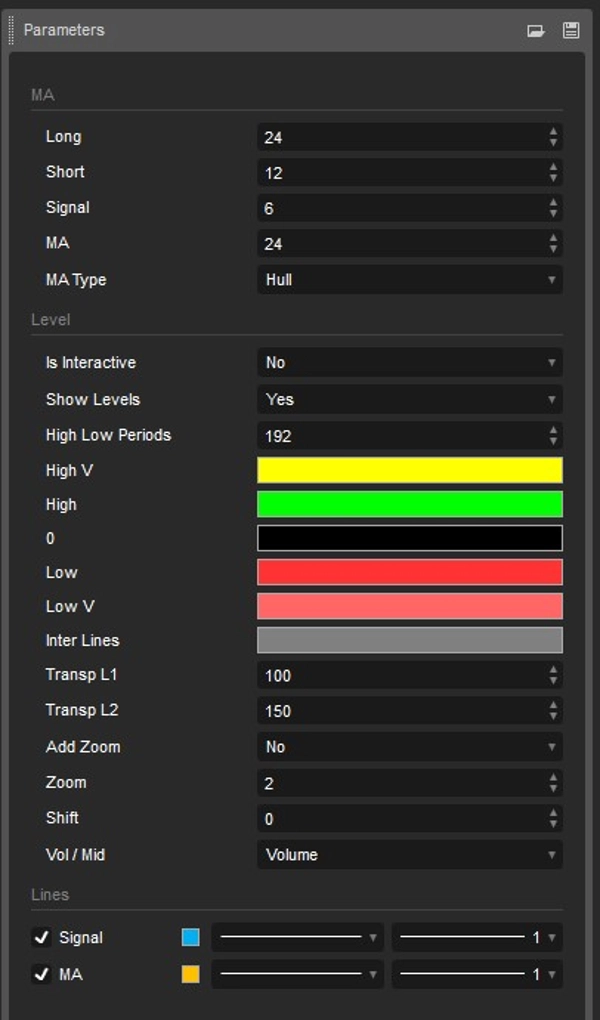
- Özelleştirilebilir Hareketli Ortalama:
-
- Mevcut seçeneklerden seçebileceğiniz ek bir hareketli ortalamayı içerir, bu da göstergenin ticaret stratejinize daha iyi uyarlanmasını sağlar.
- Yüksekler ve Düşükler:
-
- Seçilen dönemdeki en yüksek ve en düşük seviyeleri gösterir, piyasa uç noktalarının net bir görünümünü sağlar.
Faydalar:
- Görsel Netlik: Dinamik renk değişimleri, piyasa trendlerini ve dönüş noktalarını kolayca tanımlamayı sağlar.
- Özelleştirme: Farklı hareketli ortalamaları seçme ve renk seviyelerini ayarlama imkanı, göstergenin özel ihtiyaçlarınıza göre uyarlanmasını sağlar.
- Verimlilik: Otomatik yakınlaştırma, manuel ayarlama gerektirmeden her zaman göstergenin en iyi görünümünü sağlar.
- Kapsamlı Analiz: Hacim ve yüksek/düşük seviyelerin dahil edilmesi, piyasanın daha eksiksiz bir görünümünü sunar.
İdeal Kullanım:
- Teknik analizlerini geliştirmek isteyen gelişmiş ve özelleştirilebilir bir araç arayan tüccarlar.
- Piyasa trendlerinin net ve dinamik bir görselleştirmesini isteyenler.
- Ticaret araçlarında verimlilik ve özelleştirmeye değer veren kullanıcılar.
Ek araçlarla birlikte
OrderPrice V3 https://ctrader.com/products/397
NTMPICLL https://ctrader.com/products/327
Range Box Level https://ctrader.com/products/245
Or RangeBoxFibonacci https://ctrader.com/products/526
Market Session https://ctrader.com/products/525
MacdVolume https://ctrader.com/products/267
4MA https://ctrader.com/products/247
Yenilmez olacaksınız
İyi şanslar 😀
Özet
Gösterge profili
Müşteri değerlendirmeleri
5.0
Değerlendirmeler: 3
5 | 100 % | |
4 | 0 % | |
3 | 0 % | |
2 | 0 % | |
1 | 0 % |
Müşteri değerlendirmeleri
January 12, 2026
August 28, 2025
MACDVolume is a strong complementary tool for traders already using MACD. It enhances decision-making by incorporating volume, making signals more trustworthy.
April 17, 2025
Tartışma
SSS
Forex
Stocks
MACD
cTrader Store üzerinden erişilebilen işlem botları, göstergeler ve eklentiler gibi ürünler, üçüncü taraf sağlayıcılar tarafından sağlanır ve yalnızca bilgilendirme ve teknik erişim amaçlarıyla sunulur. cTrader Store bir broker değildir ve yatırım tavsiyesi, kişisel öneriler vermez veya gelecekteki performansı garanti etmez.


Fiyat
147
Satışlar
11.17K
Ücretsiz yüklemeler