
Descrizione
🌊 Tsunami Volume Surge (RVOL + Time-of-Day) è uno strumento di volume di precisione per cTrader che ti mostra quando il mercato è veramente attivo.
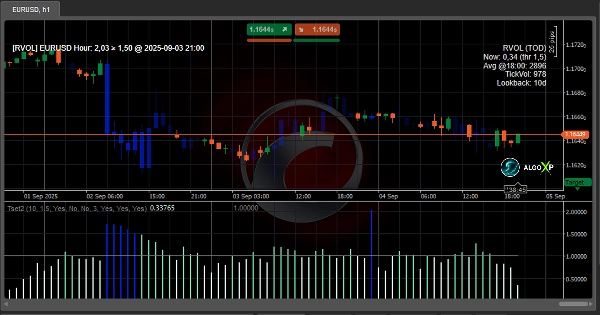
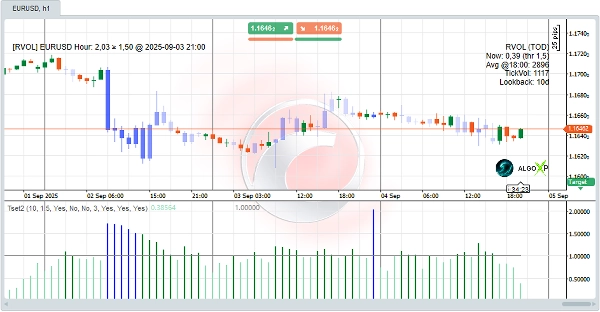
Invece di guardare il volume grezzo, Tsunami confronta l'attività di ogni barra con la media nello stesso momento della giornata durante i tuoi Giorni di Riferimento scelti. Questa normalizzazione per ora del giorno mette in evidenza picchi di partecipazione genuini che puoi tradare: considera 1.0 come “normale,” usa 1.5–2.0 per confermare le rotture, e osserva 3.0+ per movimenti esplosivi dovuti a notizie. Un pulito istogramma RVOL, colorazione dinamica delle candele, e avvisi e pop-up rendono l'energia evidente a colpo d'occhio - leggero e veloce su M1–M15 su FX, crypto e indici. I valori RVOL possono anche alimentare i tuoi cBots come filtro semplice e robusto.
Esplora più risorse e una FAQ dettagliata su AlgoXP
⚡ Come tradare con esso (avvio rapido)
- Aggiungi Tsunami sul tuo grafico (M1–M15 funziona benissimo). Imposta Giorni di Riferimento (inizia con 20–30).
- Mantieni Baseline 1.0 visibile. RVOL < 1.0 = tranquillo; ≥ 1.5–2.0 = conferma rotture; ≥ 3.0 = picco da notizie.
- Attiva Abilita Avvisi e scegli Avviso Solo alla Chiusura (più sicuro) o intrabar (più veloce).
- Usa Colora Barre per una lettura immediata dell'energia; regola Colore Barra a piacere.
- (Opzionale) Nei cBots, leggi la serie RVOL per filtrare i segnali solo alle finestre attive.
🚀 Risultato: Tsunami trasforma il volume in un vantaggio consapevole del tempo - aiutandoti a saltare i periodi morti, confermare vere rotture, e reagire più velocemente quando il mercato si risveglia.
Riepilogo
Key features include an RVOL histogram, dynamic candle coloring for quick visual assessment, and customizable alerts with pop-ups. It operates efficiently on short timeframes (M1 to M15) and supports multiple markets such as Forex, cryptocurrencies, indices, commodities, and stocks. Additionally, RVOL values can be integrated into cBots as filters to refine automated trading signals.
The indicator aims to provide a time-aware volume edge, enabling traders to avoid low-activity periods, confirm breakouts, and respond promptly to market surges. Users can adjust settings like lookback days, alert preferences, and bar colors to tailor the tool to their trading style.
Recensioni dei clienti
5 | 67 % | |
4 | 33 % | |
3 | 0 % | |
2 | 0 % | |
1 | 0 % |


