
VA Footprint
Chỉ báo
2 lượt mua
Phiên bản 2.0, May 2026
Windows, Mac
4.5
Đánh giá: 4
Mô tả
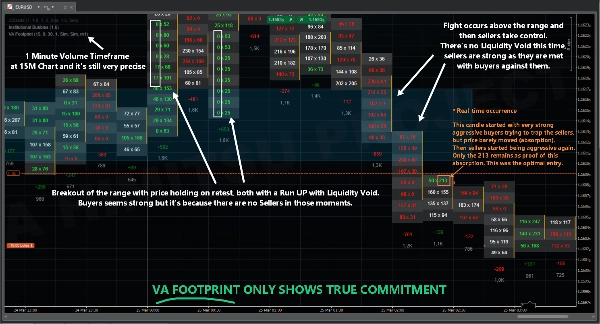
VA Footprint nhóm sự hung hăng theo các cụm tick loại bỏ nhu cầu tham chiếu chéo giữa các mức. Cấu trúc này cũng cung cấp khả năng chống lại việc giả mạo HFT (như giao dịch rửa hoặc các lệnh hung hăng lẫn trong nhiễu, nhằm che giấu ý định ở mức giá mua x bán). Vì nó đo lường cam kết qua các cụm từ 10 tick trở lên, nên rất khó và tốn kém cho hoạt động tổ chức để che giấu dấu chân của họ.
Các Tham Số Có Thể Điều Chỉnh (Cài Đặt Liên Quan)
- Thời Lượng Hộp (phút) --> Điều chỉnh để phù hợp với khung thời gian biểu đồ của bạn
- Kích Thước Mức (%)
- Chế Độ Tối (true/false)
- Hiển Thị Khu Vực Giá Trị (true/false)
- Khung Thời Gian Khối Lượng (10-ticks,50-ticks)
Những Lưu Ý Quan Trọng
- PHÁT LẠI THỊ TRƯỜNG với độ chính xác tick hoạt động, bạn có thể sử dụng điều đó để kiểm tra lại chiến lược của mình và thử nghiệm chỉ báo trong thời gian dài hơn.
- Tăng Mức Tick sẽ thêm độ chính xác, giảm quá nhiều sẽ làm giảm độ chính xác, ít nhất 0.10 được khuyến nghị.
Tóm tắt
Tóm tắt AI
VA Footprint is an order flow indicator that replaces traditional charts with a detailed footprint view, enabling precise market reading. It groups aggressive trading activity by clusters of ticks (typically 10 or more), reducing the need to cross-reference price levels and providing resilience against high-frequency trading spoofing tactics such as wash trading or disguised aggressive orders. This clustering approach makes it difficult for institutional activity to conceal their market footprints.
Key adjustable parameters include box duration (to align with chart timeframe), level size percentage, dark mode toggle, value area display, and volume timeframe selection (e.g., 10-tick or 50-tick clusters). The indicator supports market replay with tick precision, allowing users to backtest strategies over extended periods.
VA Footprint is applicable across multiple markets including Forex, indices, and stocks, and supports trading strategies such as scalping and smart money concepts. It provides visualizations, signals for divergences, breakouts, reversals, trend strength, volatility regimes, and level breaks, relying on tick data, bars, and volume inputs. This tool is designed to enhance market structure analysis and order flow understanding for traders.
Hồ sơ chỉ báo
Danh mục chỉ báo
Dòng lệnh / DOM
Loại đầu ra
Hình ảnh trực quan
Tín hiệu
Bộ lọc
Yêu cầu dữ liệu
Dữ liệu tick
Chỉ dữ liệu nến
Khối lượng
Tín hiệu được hỗ trợ
Phân kỳ
Phá vỡ giá
Đảo chiều
Sức mạnh xu hướng
Biến động
Phá ngưỡng
Đánh giá của khách hàng
4.5
Đánh giá: 4
5 | 50 % | |
4 | 50 % | |
3 | 0 % | |
2 | 0 % | |
1 | 0 % |
Đánh giá của khách hàng
April 10, 2026
A decent setup here should survive 1 percent risk without looking messy. The first month should show both ROI and DD. The next review on it on 30 trades.
April 4, 2026
For risk management, this feels more useful as a filter than a full system. The journal should cover 76 setups and the trade context.
April 4, 2026
The stats tell the story. Tracking 1 percent risk first, compare the result with BE after 1R, and only scale if 1.5R partials still looks controlled.
March 31, 2026
Feels right for a user who wants less noise in the process. The best use is sizing and stop planning, then leaving the final filter manual. The problem appears when the tool makes weak ideas look acceptable.5R partials.
Thảo luận
Câu hỏi thường gặp
Prop
Forex
Scalping
Indices
SMC
Stocks
Market Structure
Các sản phẩm có sẵn trên cTrader Store, bao gồm bot giao dịch, chỉ báo và plugin, được cung cấp bởi các nhà phát triển bên thứ ba và chỉ nhằm mục đích cung cấp thông tin và tiếp cận kỹ thuật. cTrader Store không phải là nhà môi giới và không cung cấp lời khuyên đầu tư, khuyến nghị cá nhân hay bất kỳ đảm bảo nào về hiệu suất trong tương lai.
Sản phẩm khác của tác giả này


Giá
Kể từ 24/03/2026
10
Lượt bán
62
Cài đặt miễn phí