
Risk Guardian – Prop Firm HUD
Chỉ báo
1 lượt mua
Phiên bản 1.0, Jan 2026
Windows, Mac
4.5
Đánh giá: 2
Mô tả
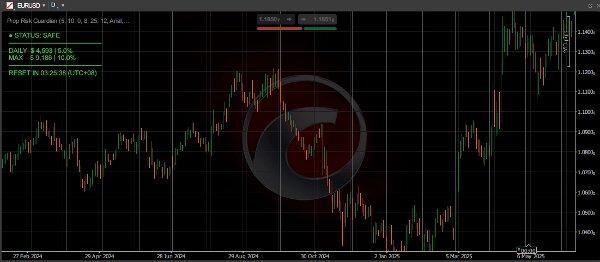
Risk Guardian – Prop Firm HUD
Risk Guardian là một HUD giám sát rủi ro nhẹ, chuyên nghiệp được xây dựng đặc biệt cho các nhà giao dịch công ty prop.
Nó hiển thị Mức lỗ hàng ngày còn lại và Mức giảm tối đa của bạn theo thời gian thực — sử dụng logic dựa trên số dư, chính xác cách các công ty prop đánh giá thất bại tài khoản.
Không có chỉ báo.
Không có tín hiệu.
Không có sự lộn xộn.
Chỉ những con số quyết định bạn thành công hay thất bại.
Tính năng chính
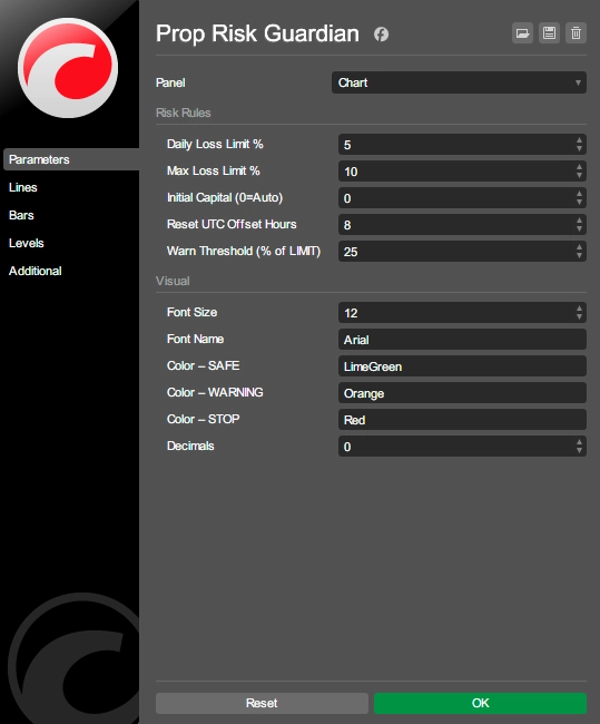
✔ Logic rủi ro đúng của công ty prop
- Mức lỗ hàng ngày và tối đa được tính từ số dư tài khoản ban đầu
- Mức lỗ hàng ngày tự động bị giới hạn bởi mức giảm tối đa còn lại
- Phù hợp với các quy tắc thực tế của công ty prop (FTMO, MyFundedFX, E8, v.v.)
✔ Tính toán dựa trên số dư
- Sử dụng Số dư, không phải vốn chủ sở hữu nổi
- Tránh hiểu nhầm về lợi nhuận và lỗ chưa thực hiện
✔ Phát hiện số dư ban đầu tự động
- Tự động khóa số dư ban đầu khi lần đầu tiên được gắn vào
- Hỗ trợ ghi đè thủ công cho các kích thước tài khoản khác nhau (50K / 100K / 200K)
✔ HUD kiểu Apple sạch sẽ
- HUD hệ thống cố định ở góc trên bên trái
- Kiểu chữ căn trái thực sự
- Thiết kế tối giản, khả năng đọc tối đa
✔ Đếm ngược đặt lại hàng ngày
- Hiển thị thời gian còn lại đến khi đặt lại hàng ngày
- Điều chỉnh bù UTC (UTC±XX)
✔ Nhẹ và hiệu quả
- Cập nhật dựa trên bộ đếm thời gian (không phải theo từng tick)
- Sử dụng CPU rất thấp
- An toàn khi chạy trên nhiều biểu đồ
Tóm tắt
Tóm tắt AI
Risk Guardian – Prop Firm HUD is a lightweight, real-time risk monitoring indicator designed specifically for prop firm traders. It provides a clean, minimalistic heads-up display (HUD) showing key risk metrics that determine account status under prop firm rules. The HUD tracks remaining Daily Loss and Maximum Drawdown limits based on the initial account balance, reflecting how prop firms like FTMO, MyFundedFX, and E8 evaluate account failure.
Key functionalities include:
- Prop-firm accurate risk logic with daily and maximum loss calculated from the initial balance.
- Daily loss automatically capped by the remaining maximum drawdown.
- Balance-based calculations using actual balance rather than floating equity to avoid misleading unrealized profit/loss.
- Automatic detection and locking of the initial account balance when first attached, with manual override options for common account sizes (50K, 100K, 200K).
- A fixed, top-left Apple-style HUD with left-aligned typography for clear readability.
- A daily reset countdown timer with adjustable UTC offset.
- Efficient, timer-based updates that minimize CPU usage and allow safe operation on multiple charts simultaneously.
This indicator supports various markets including Forex, indices, commodities, stocks, and cryptocurrencies, aligning with prop trading requirements without providing trading signals or clutter.
Hồ sơ chỉ báo
Đánh giá của khách hàng
4.5
Đánh giá: 2
5 | 50 % | |
4 | 50 % | |
3 | 0 % | |
2 | 0 % | |
1 | 0 % |
Đánh giá của khách hàng
February 7, 2026
Thảo luận
Câu hỏi thường gặp
BTCUSD
Forex
Signal
Indices
EURUSD
Commodities
GBPUSD
NZDUSD
Prop
Crypto
Stocks
XAUUSD
NAS100
USDJPY
Các sản phẩm có sẵn trên cTrader Store, bao gồm bot giao dịch, chỉ báo và plugin, được cung cấp bởi các nhà phát triển bên thứ ba và chỉ nhằm mục đích cung cấp thông tin và tiếp cận kỹ thuật. cTrader Store không phải là nhà môi giới và không cung cấp lời khuyên đầu tư, khuyến nghị cá nhân hay bất kỳ đảm bảo nào về hiệu suất trong tương lai.


Giá
Kể từ 09/04/2025