
KANDIKA HEAT MAP
Chỉ báo
1 lượt mua
Phiên bản 1.0, Jul 2025
Windows, Mac
4.6
Đánh giá: 3
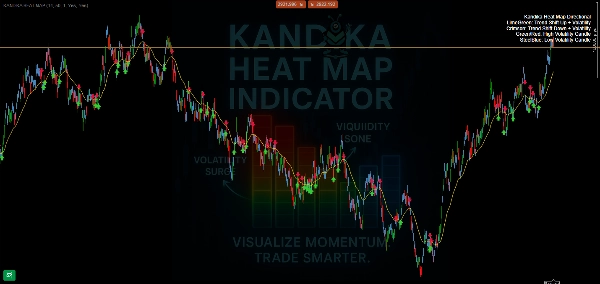
🎨 Logic Màu Sắc – Những Gì Nó Nói Với Bạn
- 🟩 Xanh Chanh → Chuyển Đổi Xu Hướng Tăng
Một sự thay đổi động lực tăng đang hình thành. Sử dụng nó để bắt kịp đà tăng sớm. - 🟥 Đỏ Tươi → Chuyển Đổi Xu Hướng Giảm
Báo hiệu áp lực giảm đang tăng lên. Chuẩn bị cho các vị thế bán khống hoặc thoát lệnh tiềm năng. - 🟧/🔴 Cam/Đỏ → Khu Vực Biến Động Cao
Dự kiến giá sẽ tăng vọt, di chuyển nhanh và có thể có bẫy. Không phải nơi để đoán mò—hãy xác nhận chiến lược của bạn. - 🟦 Xanh Thép → Khu Vực Biến Động Thấp
Thị trường đang chậm lại, nén lại hoặc đi ngang. Thường thiết lập cơ hội bứt phá.
📊 Những Gì Nó Làm (Và Không Làm)
- ✅ Rõ ràng vẽ ra các thay đổi hướng xu hướng
- ✅ Phân tách trực quan các khu vực yên tĩnh và biến động
- ✅ Lớp phủ đơn giản, thân thiện với biểu đồ—không rối mắt
Hồ sơ chỉ báo
4.6
Đánh giá: 3
5 | 67 % | |
4 | 33 % | |
3 | 0 % | |
2 | 0 % | |
1 | 0 % |
Đánh giá của khách hàng
August 4, 2025
No reason to yolo this live without a few normal sessions, and Bad settings can ruin the idea.
July 26, 2025
20 percent less clicking is the line to watch. Market checks feel quicker.
Các sản phẩm có sẵn trên cTrader Store, bao gồm bot giao dịch, chỉ báo và plugin, được cung cấp bởi các nhà phát triển bên thứ ba và chỉ nhằm mục đích cung cấp thông tin và tiếp cận kỹ thuật. cTrader Store không phải là nhà môi giới và không cung cấp lời khuyên đầu tư, khuyến nghị cá nhân hay bất kỳ đảm bảo nào về hiệu suất trong tương lai.


![Logo "High-Low Divergence [Iridio Capital]"](https://cdn.ctrader.com/image/webp/443c4661-7abb-40f1-842f-4b6ec560649b_40914)


Kể từ 08/06/2025
1
Lượt bán