

Mô tả
Phân phối Tâm trạng Sâu (DMD) 📊🧠
Tổng quan
Phân phối Tâm trạng Sâu (DMD) là một công cụ hồ sơ khối lượng phân đoạn và tâm lý phân tích hành động giá trong các khối thanh cố định và hiển thị:
- Nơi hoạt động giao dịch tập trung ⚖️
- Nơi thanh khoản mỏng hoặc phản ứng (các vùng S&D / thanh khoản tiềm năng) 💧
- Bên nào chiếm ưu thế tại mỗi khu vực giá (người mua vs người bán) 🐂🐻
Thay vì một hồ sơ trượt đơn lẻ, DMD chia biểu đồ thành các khối lặp lại gồm X thanh và xây dựng bản đồ thanh khoản & tâm lý riêng biệt cho mỗi khối.
Điều này giúp dễ dàng so sánh trực quan cách phân phối khối lượng và tâm trạng thị trường thay đổi từ phân đoạn này sang phân đoạn tiếp theo.
Cách hoạt động 🧩
Đối với mỗi khối gồm Bars In Profile nến:
- Chỉ báo tìm giá cao nhất và thấp nhất của khối đó.
- Phạm vi giá được chia thành
Number of Rowskhoang giá dọc. - Đối với mỗi cây nến trong khối:
-
- Khối lượng tick được phân phối trên mỗi khoang giá mà phạm vi cây nến chạm tới.
- Hai loại khối lượng được tích lũy cho mỗi hàng:
-
- Tổng khối lượng tại hàng giá đó
- Khối lượng tăng giá (chỉ các thanh mà Đóng > Mở)
- Từ đó, DMD xây dựng:
-
- Hồ sơ thanh khoản (bên phải)
-
- Chiều dài hàng ∝ khối lượng tương đối so với khối lượng hàng tối đa của khối
- Màu sắc hiển thị các nút giao dịch cao / trung bình / thấp
- Hồ sơ tâm lý (bên trái)
-
- Tâm lý mỗi hàng =
2 × BullishVolume − TotalVolume - Dương = bên mua chiếm ưu thế (tâm trạng tăng giá)
- Âm = bên bán chiếm ưu thế (tâm trạng giảm giá)
- Tâm lý mỗi hàng =
- Quá trình được lặp lại cho N khối cuối cùng, để bạn có thể so sánh nhiều phân đoạn cạnh nhau.
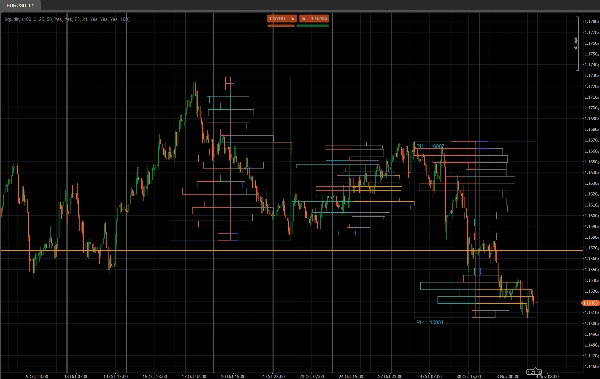
Bên phải – Hồ sơ Thanh khoản (Khối lượng) 📊
Các thanh bên phải hiển thị mức độ hoạt động giao dịch (khối lượng) xảy ra ở mỗi mức giá trong khối đó, bất kể ai đang mua hay bán.
- Các nút khối lượng cao (HVN) – ví dụ thanh màu cam
-
- Một hàng có khối lượng ≥
Ngưỡng Giao dịch Cao %của khối lượng hàng tối đa trong khối - Biểu thị vùng giá trị, giao dịch nặng, vùng hợp nhất.
- Một hàng có khối lượng ≥
- Các nút khối lượng thấp (LVN) – ví dụ thanh màu xanh dương
-
- Một hàng có khối lượng ≤
Ngưỡng Giao dịch Thấp %của khối lượng hàng tối đa - Biểu thị vùng thanh khoản mỏng, có thể là vùng từ chối hoặc vùng di chuyển nhanh.
- Một hàng có khối lượng ≤
- Các nút khối lượng trung bình – ví dụ thanh màu xám
-
- Tất cả các giá trị giữa ngưỡng cao và thấp
- Mức giao dịch “bình thường”, không cực đoan.
🧠 Chiều dài thanh (bên phải)
→ Tỷ lệ với tổng khối lượng giao dịch tại hàng giá đó so với khối lượng tối đa của khối.
Khối lượng nhiều hơn → thanh dài hơn.
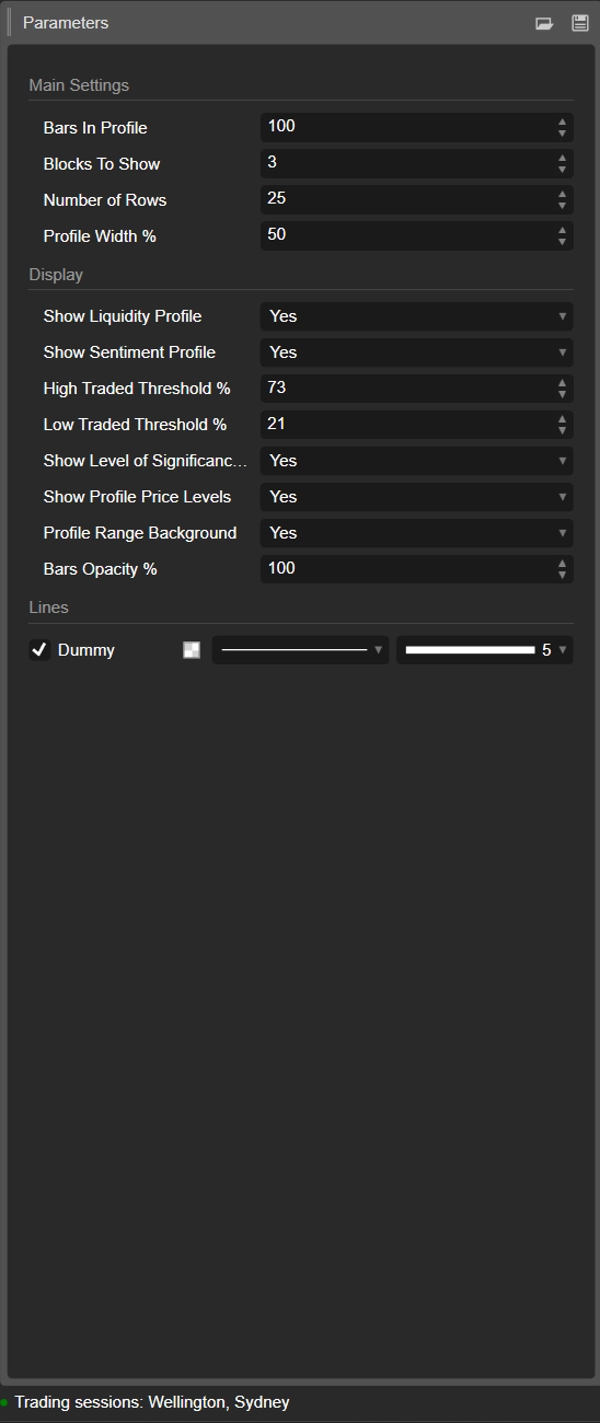
Các tham số chính:
Ngưỡng Giao dịch Cao %Ngưỡng Giao dịch Thấp %
Bên trái – Hồ sơ Tâm lý (Tâm trạng Thị trường) 🧠📉📈
Các thanh bên trái hiển thị tâm lý / sự chiếm ưu thế tại mỗi mức giá: bên mua hay bên bán mạnh hơn ở hàng đó.
Đối với mỗi hàng:
Tâm lý=2×Khối lượng tăng−Tổng khối lượng\text{Sentiment} = 2 \times \text{BullishVolume} - \text{TotalVolume}Sentiment=2×BullishVolume−TotalVolume
- Thanh tăng giá (bên mua kiểm soát) – ví dụ thanh màu xanh ngọc/lục
-
- Tâm lý > 0
- Nhiều khối lượng đến từ các cây nến tăng giá (Đóng > Mở) tại mức giá đó.
- Chỉ ra sự chiếm ưu thế của bên mua ở hàng giá đó.
- Thanh giảm giá (bên bán kiểm soát) – ví dụ thanh màu đỏ
-
- Tâm lý < 0
- Nhiều khối lượng đến từ các cây nến giảm giá (Đóng < Mở).
- Chỉ ra sự chiếm ưu thế của bên bán.
🧠 Chiều dài thanh (bên trái)
→ Tỷ lệ với giá trị tuyệt đối của tâm lý (|Tâm lý|) so với hàng mạnh nhất trong khối.
Sự chiếm ưu thế mạnh hơn (mất cân bằng lớn giữa người mua và người bán) → thanh dài hơn.
Tham số chính:
Hiển thị Hồ sơ Tâm lý(bật/tắt)
Chi tiết tham số ⚙️
1. Bars In Profile
Nhóm: Cài đặt chính
Số lượng nến chứa trong mỗi khối.
- Ví dụ:
Bars In Profile = 100 -
- Khối 0 → 100 thanh cuối cùng
- Khối 1 → 100 thanh trước đó
- Khối 2 → 100 thanh trước nữa, và cứ thế tiếp tục.
Sử dụng để khớp các khối với:
- khoảng phiên giao dịch gần đúng,
- khoảng dao động swing / trong ngày điển hình của bạn,
- hoặc bất kỳ cửa sổ tùy chỉnh nào bạn muốn phân tích.
Giá trị nhỏ hơn = phản ứng nhanh hơn, chi tiết hơn.
Giá trị lớn hơn = cấu trúc mượt mà hơn, mang tính “vĩ mô” hơn.
2. Blocks To Show
Nhóm: Cài đặt chính
Số lượng khối liên tiếp sẽ được vẽ trên biểu đồ.
1→ chỉ khối gần nhất2–3→ rất tiện để so sánh mà không bị rối- Giá trị cao hơn → nhiều lịch sử hơn, nhưng nhiều đối tượng trên biểu đồ hơn
Các khối cũ hơn giá trị này sẽ tự động được dọn dẹp để duy trì sự ổn định.
3. Number of Rows
Nhóm: Cài đặt chính
Độ phân giải dọc của hồ sơ mỗi khối.
Phạm vi giá của khối được chia thành số hàng (mức giá) này.
- Giá trị cao hơn → chi tiết hơn, hàng mỏng hơn, nhiều hình chữ nhật hơn
- Giá trị thấp hơn → cấu trúc mượt mà hơn, dễ đọc hơn
Phạm vi điển hình:
15–25cho sử dụng trong ngày bình thường30–40+chỉ nếu bạn muốn độ phân giải rất cao và nền tảng của bạn đủ mạnh
4. Profile Width %
Nhóm: Cài đặt chính
Kiểm soát mức độ mở rộng theo chiều ngang của hồ sơ từ trung tâm khối, tính theo phần trăm chiều rộng khối.
- Ảnh hưởng cả thanh khoản (bên phải) và tâm lý (bên trái).
- Phần trăm cao hơn → hồ sơ mở rộng xa hơn vào các thanh xung quanh
- Phần trăm thấp hơn → hồ sơ gọn gàng gần trung tâm khối
Giá trị khởi đầu tốt: 35–50%.
5. Hiển thị Hồ sơ Thanh khoản
Nhóm: Hiển thị
Bật hoặc tắt phân phối khối lượng (hồ sơ thanh khoản) (bên phải mỗi khối).
- Bật ✅
-
- Chiều dài mỗi hàng phản ánh khối lượng giao dịch tương đối tại mức giá đó.
- Màu sắc mã hóa các nút giao dịch cao / trung bình / thấp.
- Tắt ❌
-
- Chỉ hiển thị tâm lý (nếu được bật), không có thanh khối lượng bên phải.
6. Hiển thị Hồ sơ Tâm lý
Nhóm: Hiển thị
Bật hoặc tắt hồ sơ tâm lý (bên trái mỗi khối).
- Bật ✅
-
- Các hàng được tô màu:
-
- Tăng giá (bên mua chiếm ưu thế) – ví dụ màu xanh ngọc/lục
- Giảm giá (bên bán chiếm ưu thế) – ví dụ màu đỏ
- Chiều dài hàng phản ánh độ mạnh của sự chiếm ưu thế.
- Tắt ❌
-
- Chỉ hiển thị phân phối thanh khoản/khối lượng thuần túy.
Sử dụng nếu bạn muốn thấy không chỉ nơi khối lượng được giao dịch, mà còn ai hoạt động nhiều hơn ở các mức đó.
7. Ngưỡng Giao dịch Cao %
Nhóm: Hiển thị
Xác định ngưỡng cho các nút khối lượng cao (HVN) bên trong mỗi khối.
- Biểu thị dưới dạng % của khối lượng hàng tối đa trong khối.
- Ví dụ: Khối lượng hàng tối đa = 10.000; ngưỡng = 70% → các hàng ≥ 7.000 được tính là HVN.
HVN thường đánh dấu:
- vùng giá trị,
- vùng hợp nhất,
- vùng định vị mạnh / giá trị công bằng.
8. Ngưỡng Giao dịch Thấp %
Nhóm: Hiển thị
Xác định ngưỡng cho các nút khối lượng thấp (LVN) so với khối lượng tối đa của khối.
- Các hàng có khối lượng dưới tỷ lệ phần trăm này được coi là vùng hoạt động thấp.
- Chúng có thể đóng vai trò như:
-
- các túi thanh khoản mỏng,
- các mức từ chối tiềm năng,
- hoặc các vùng giá có xu hướng di chuyển nhanh qua.
Sử dụng điển hình: 15–30%.
9. Hiển thị Mức độ Quan trọng (POC)
Nhóm: Hiển thị
Hiển thị hoặc ẩn Điểm Kiểm soát (POC) cho khối gần nhất.
- POC = hàng giá có khối lượng giao dịch cao nhất trong khối đó.
- Hiển thị dưới dạng đường ngang tại mức giá đó. 🎯
Hữu ích như:
- tham chiếu cho sự quay về trung bình,
- mỏ neo “giá công bằng” trong ngày,
- hoặc mức quan trọng để quản lý giao dịch.
10. Hiển thị Mức giá Hồ sơ
Nhóm: Hiển thị
Hiển thị nhãn văn bản cho:
- Giá cao hồ sơ (PH) – giá cao nhất đạt được trong khối
- Giá thấp hồ sơ (PL) – giá thấp nhất đạt được trong khối
Nhãn được hiển thị cho khối gần nhất và bao gồm giá chính xác.
Rất hữu ích cho:
- đọc nhanh phạm vi hiện tại,
- đặt dừng/lợi nhuận quanh PH/PL,
- bối cảnh cho các đột phá hoặc xoay vòng.
11. Nền phạm vi Hồ sơ
Nhóm: Hiển thị
Vẽ hình chữ nhật nền bán trong suốt bao phủ phạm vi:
- phạm vi thời gian (từ thanh bắt đầu đến thanh kết thúc)
- phạm vi giá (từ thấp đến cao)
Điều này giúp phân tách trực quan các khối và làm nổi bật mỗi phạm vi.
Tắt nếu bạn thích giao diện sạch sẽ, tối giản hơn.
12. Độ mờ của Thanh %
Nhóm: Hiển thị
Kiểm soát mức độ đậm đặc hoặc nhẹ nhàng của các hình chữ nhật (cả thanh khoản và tâm lý).
- 20–40% → rất nhẹ, kiểu nền
- 50–70% → cân bằng, vẫn dễ nhìn thấy nến
- 80–100% → mạnh mẽ, gần như không trong suốt
Giá trị này được chuyển đổi thành kênh alpha (0–255) cho màu thanh.
Mẫu khởi đầu đề xuất ⭐
Cho chỉ số / hợp đồng tương lai trong ngày (M5–M15):
- Bars In Profile: 80–120
- Blocks To Show: 2–3
- Number of Rows: ~20
- Profile Width %: 35–45
- Show Liquidity Profile: true
- Show Sentiment Profile: true
- Bars Opacity %: 50–65
Tóm tắt
Key features include:
- Liquidity Profile (right side): Displays trading volume concentration at each price level within a block, highlighting high-volume nodes (HVNs), low-volume nodes (LVNs), and average-volume nodes. Bar length corresponds to relative traded volume, and colors indicate volume intensity.
- Sentiment Profile (left side): Shows buyer vs. seller dominance per price level, calculated as twice the bullish volume minus total volume. Positive values indicate buy-side control; negative values indicate sell-side control. Bar length reflects the strength of dominance, with color coding for bullish (green/teal) and bearish (red) sentiment.
- Configurable parameters: number of bars per profile block, number of blocks displayed, vertical resolution (rows), profile width, opacity, and thresholds for defining HVNs and LVNs.
- Additional display options: Point of Control (POC) line for highest volume price in the latest block, profile high/low price labels, and background shading for block ranges.
DMD supports analysis across various markets including indices, commodities, forex, and cryptocurrencies, facilitating identification of trading activity concentration, liquidity zones, and market sentiment shifts within customizable timeframes.
Đánh giá của khách hàng
5 | 0 % | |
4 | 100 % | |
3 | 0 % | |
2 | 0 % | |
1 | 0 % |


![Logo "[Hamster-Coder] Moving Average MTF"](https://cdn.ctrader.com/image/webp/b11b98b1-194d-4b8e-b00e-d611826ad159_31226)
