
MACD Histogram PRO
Индикатор
4 покупки
Версия 1.0, Oct 2025
Windows, Mac
4.5
Отзывы: 2
Описание
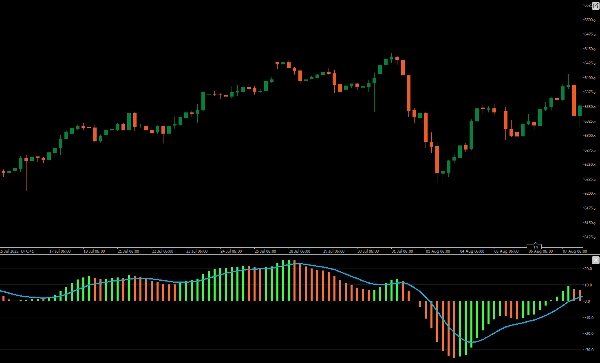
Представляем улучшенный MACD Histogram, созданный для более ясного и информативного торгового опыта.
Этот обновленный индикатор отображает яркую, цветную гистограмму, которая различает бычьи и медвежьи изменения цены, выходя за рамки стандартного одноцветного формата. Используя разные цвета для положительных и отрицательных движений, он предлагает мгновенный визуальный сигнал о состоянии рынка, облегчая интерпретацию изменений импульса и возможных разворотов тренда.
Идеально подходит для трейдеров, стремящихся к повышенной ясности и точности, это MACD Histogram обновление превращает ваш график в более мощный аналитический инструмент. Повышайте свою торговую стратегию с помощью улучшенного MACD Histogram.
Сводка
ИИ-сводка
MACD Histogram PRO is an enhanced technical indicator designed to improve the visualization of the traditional MACD histogram. It displays a vibrant, color-coded histogram that clearly differentiates bullish and bearish price movements, providing immediate visual cues on market momentum and potential trend reversals. This indicator supports analysis across various markets and symbols including Forex (EURUSD, GBPUSD, NZDUSD, USDJPY), cryptocurrencies (BTCUSD, crypto), commodities (XAUUSD, gold, oil, silver), indices (NAS100, SP500, DAX, Dow), and stocks. By using distinct colors for positive and negative momentum shifts, it aids traders in interpreting market conditions with greater clarity and precision. The MACD Histogram PRO is suitable for strategies involving signals and scalping, enhancing chart analysis for more informed trading decisions.
Профиль индикатора
Отзывы покупателей
4.5
Отзывы: 2
5 | 50 % | |
4 | 50 % | |
3 | 0 % | |
2 | 0 % | |
1 | 0 % |
Отзывы покупателей
October 22, 2025
the only reason it stays interesting is one quick look should not become the only input, and 1.5R target is the line to watch.
October 17, 2025
Обсуждение
Частые вопросы
BTCUSD
Forex
Signal
Indices
EURUSD
Commodities
GBPUSD
NZDUSD
Prop
Scalping
Crypto
Stocks
XAUUSD
NAS100
MACD
USDJPY
Продукты, доступные в cTrader Store, включая торговых ботов, индикаторы и плагины, предоставляются сторонними разработчиками и доступны исключительно в информационных и технических целях. cTrader Store не является брокером и не предоставляет инвестиционные консультации, персональные рекомендации или какие-либо гарантии будущей доходности.


![Логотип продукта "Gaussian Channel [Iridio Capital]"](https://cdn.ctrader.com/image/webp/7c039209-5573-4a54-a072-f9528b503103_41960)


Цена
С 25/09/2025
25
Продажи
315
Бесплатные установки