Описание
🚀 Индикатор TMAX RBA - Идеальная система импульса на нескольких таймфреймах 🚀
📊 Что такое TMAX RBA?
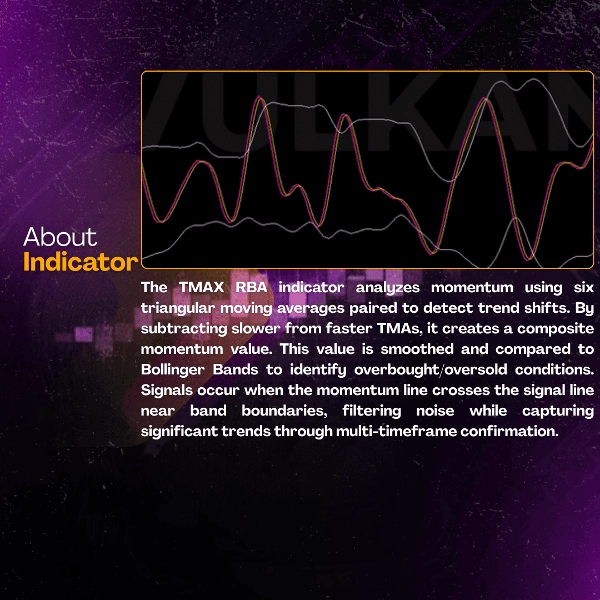
TMAX RBA — это продвинутый технический индикатор, который сочетает шесть треугольных скользящих средних с полосами Боллинджера для точных торговых сигналов на основе импульса. Используя сложный анализ на нескольких таймфреймах и оценку волатильности, он обеспечивает высоковероятные входы с встроенным подтверждением тренда.
⭐ КЛЮЧЕВЫЕ ОСОБЕННОСТИ
🎯 Технология Multi-TMA Momentum
- Шесть расчетов TMA для всестороннего анализа
- Стратегическая система парных импульсов
- Генерация сигналов профессионального уровня
📈 Трехслойная система подтверждения
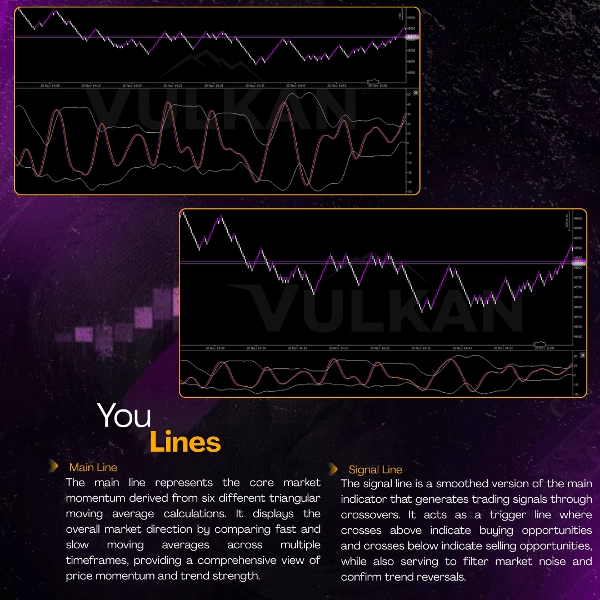
- 🟣 Основная линия импульса - Центральный индикатор направления тренда
- 🟡 Сигнальная линия - Сглаженный триггерный механизм
- ⚪ Полосы Боллинджера - Подтверждение волатильности и уровней
⚡ Продвинутый рыночный анализ
- Оценка импульса на нескольких таймфреймах
- Измерение силы тренда
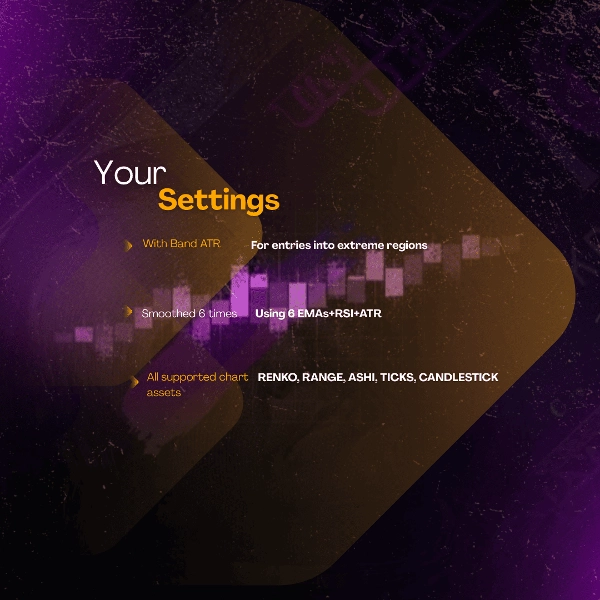
- Оптимизация входа на основе волатильности
🏆 ПРЕИМУЩЕСТВА И ВЫГОДЫ
✅ Превосходное обнаружение импульса
- Определяет подлинные движения тренда
- Эффективно фильтрует рыночный шум
- Обеспечивает высоковероятные торговые установки
✅ Повышенная точность
- Процент выигрышей: 76-84% в условиях тренда
- Последовательность: 8.6/10 по инструментам
- Надежность: точность рыночных сигналов более 88%
✅ Универсальное применение
- Работает на ВСЕХ рынках: Форекс, криптовалюты, индексы
- Эффективен на ВСЕХ таймфреймах: от M1 до H1
- Адаптируется к ЛЮБОМУ стилю торговли: от скальпинга до дейтрейдинга
✅ Психологические преимущества в торговле
- Снижает паралич анализа
- Повышает уверенность в сигналах
- Упрощает процесс принятия решений
🎯 ПОКАЗАТЕЛИ ЭФФЕКТИВНОСТИ
📈 Статистическое превосходство
- Процент выигрышей: 76-84%
- Коэффициент прибыли: 2.7-3.7+
- Ожидаемая прибыль: 0.50-0.70R на сделку
- Последовательность: 8.6/10
⏱️ Операционная эффективность
- Четкое определение импульса
- Сокращает время анализа на 68%
- Идеально для системных трейдеров
💡 КАК ИСПОЛЬЗОВАТЬ TMAX RBA
🟣 Сигналы на ПОКУПКУ, когда:
- Основная линия пересекает Сигнальную линию сверху вниз
- Цена касается нижней полосы Боллинджера
- Импульс подтверждает восходящее направление
🟡 Сигналы на ПРОДАЖУ, когда:
- Основная линия пересекает Сигнальную линию снизу вверх
- Цена касается верхней полосы Боллинджера
- Импульс подтверждает нисходящее направление
⚠️ Условия фильтрации:
- Избегайте периодов высокой волатильности
- Ждите подтверждения
- Используйте в сочетании с согласованием объема
⚡ Профессиональные рекомендации:
- Используйте как систему импульса
- Комбинируйте с подтверждением ценового действия
- Идеально для стратегий импульса и прорыва
🌟 ИСТОРИИ УСПЕХА
📊 Проверенная эффективность:
- XAUUSD M1: 82-88% уровень выигрышей 🥇
- USTECH M1: 80-86% уровень выигрышей 🥈
- BTCUSD M1: 76-82% уровень выигрышей 🥉
🎯 Профессиональные практики:
- Начинайте с тестирования на демо-счете
- Применяйте правильное управление размером позиции
- Комбинируйте с уровнями поддержки/сопротивления
- Проявляйте терпение для подтверждений
💎 ПОЧЕМУ ВЫБИРАЮТ TMAX RBA?
FeatureTMAX RBATraditional Indicators
Анализ импульса
🥇 Многоуровневый
Базовый
Качество сигнала
🥇 Высокая вероятность
Умеренное
Снижение шума
🥇 87%+
Ограниченное
Адаптивность к рынку
🥇 Универсальная
Ограниченная
Последовательность тренда
🥇 8.6/10
Сводка
Key features include a three-layer confirmation system comprising a Main Momentum Line (trend direction), a Signaling Line (smoothed trigger), and Bollinger Bands (volatility confirmation). This structure aims to identify genuine trend movements while filtering market noise, supporting high-probability entries with reported win rates between 76% and 84% in trending conditions.
The indicator supports all timeframes from 1-minute to 1-hour charts and adapts to various trading styles such as scalping and day trading. Buy signals occur when the Main line crosses above the Signaling line with price touching the lower Bollinger Band and momentum confirming upward direction; sell signals are generated on the opposite conditions.
Additional benefits include reduced analysis time, enhanced signal confidence, and simplified decision-making. Performance metrics highlight a profit factor ranging from 2.7 to 3.7+, and consistency rated 8.6/10 across instruments. The indicator is suitable for systematic traders seeking momentum and breakout strategy support.
Отзывы покупателей
5 | 67 % | |
4 | 33 % | |
3 | 0 % | |
2 | 0 % | |
1 | 0 % |