
Описание
Индикатор BLOCK LIQUIDITY сочетает два основных подхода к анализу рынка:
Обнаружение ордерных блоков:
Определяет зоны поддержки и сопротивления на основе неперебитых максимумов и минимумов за период просмотра.
Генерирует сигналы на покупку, когда цена закрывается выше неперебитого минимума.
Генерирует сигналы на продажу, когда цена закрывается ниже неперебитого максимума.
Анализ ликвидности:
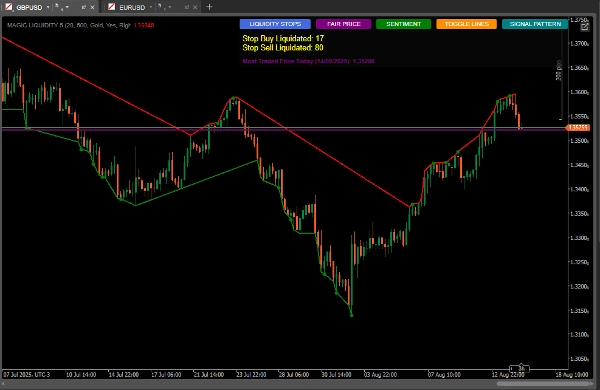
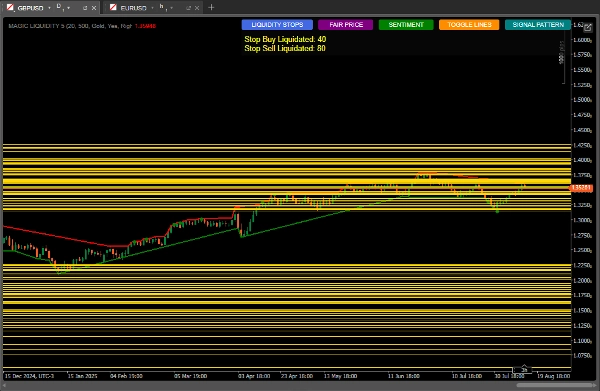
Обнаруживает пулы ликвидности (зоны, где могут сосредотачиваться стоп-лоссы).
Отслеживает активацию стопов на покупку и продажу.
Вычисляет настроение рынка на основе распределения ликвидности.
Определяет наиболее торгуемую цену (справедливую цену).
Как использовать для достижения лучших результатов
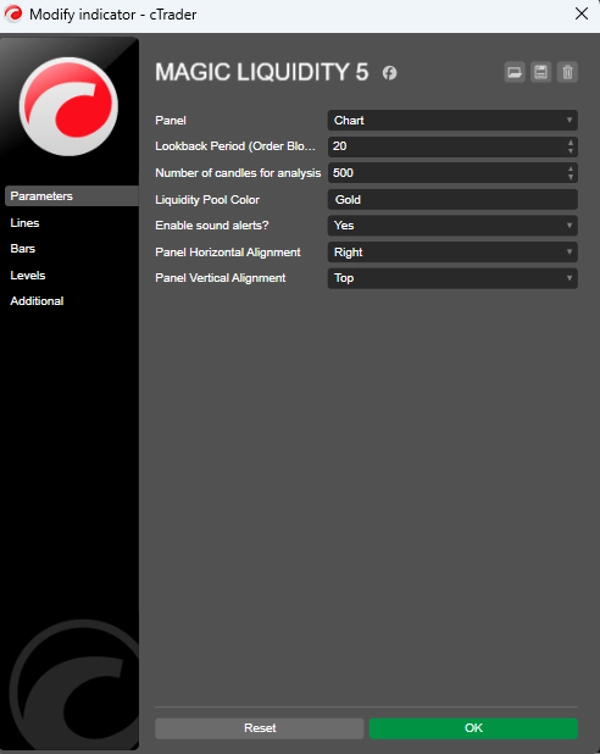
Начальная настройка
Период просмотра: Настройте параметр "Lookback Period" в соответствии с таймфреймом, на котором вы торгуете (большие значения для больших таймфреймов).
Количество свечей для анализа: Оставьте 500 для надежного анализа или уменьшите для более быстрой реакции.
Цвет пула ликвидности: Выберите цвет, который выделяется на вашем графике.
Интерпретация сигналов
Сигналы ордерного блока:
Зеленые точки: сигналы на покупку, когда цена закрывается выше неперебитого минимума.
Красные точки: сигналы на продажу, когда цена закрывается ниже неперебитого максимума.
Пулы ликвидности:
Горизонтальные линии показывают зоны ликвидности (потенциальные цели или точки разворота).
Отслеживайте соотношение ликвидности выше/ниже текущей цены.
Настроение рынка:
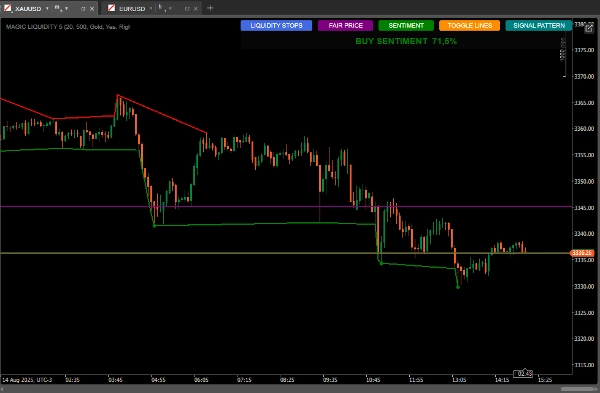
Используйте кнопку "SENTIMENT", чтобы увидеть преобладающее направление и уверенность.
Покупательское настроение с высокой уверенностью указывает на продолжение роста. Продавец с высокой уверенностью — на продолжение медвежьего тренда.
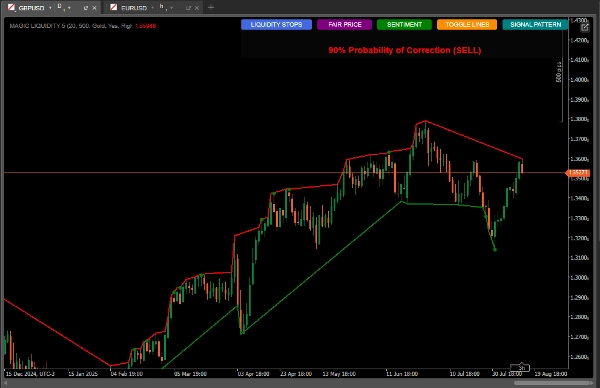
Свечные паттерны:
Кнопка "SIGNAL PATTERN" анализирует и
Показывает вероятности коррекции на основе количественного соотношения
Наиболее торгуемая цена (справедливая цена):
Кнопка "FAIR PRICE" показывает уровень цены с наибольшим объемом за день.
Она может выступать как магнит для цен или как поддержка/сопротивление.
Стратегии использования
Консервативная стратегия:
Торгуйте только когда сигналы ордерного блока совпадают с преобладающим настроением.
Используйте пулы ликвидности как цели для фиксации прибыли.
Агрессивная стратегия:
Ожидайте развороты, когда цена приближается к пулам ликвидности с большим количеством накопленных стопов.
Используйте дивергенции между настроением и ценовым движением для контртрендовых сделок.
Дополнительное подтверждение:
Сравните с свечным паттерном, показанным индикатором.
Проверьте, находится ли справедливая цена поблизости как зона интереса.
Управление рисками.
Стоп-лосс:
Размещайте ниже последнего ордерного блока для покупок
Размещайте выше последнего ордерного блока для продаж
Тейк-профит:
Цели в ближайших пулах ликвидности
Учитывайте соотношение ликвидности выше/ниже для установки целей
Расширенные советы
Используйте кнопку "TOGGLE LINES" для отключения линий ликвидности, когда график становится загроможденным
Отслеживайте количество ликвидированных стопов для оценки силы движения
Справедливая цена особенно полезна на рынках с ограниченным диапазоном, выступая как динамическая поддержка/сопротивление
Комбинируйте с другими индикаторами для подтверждения (объем, скользящие средние)
Объем индикатора:
https://ctrader.com/pt/products/635
Сводка
Users can customize parameters such as lookback period and number of candles analyzed to suit different timeframes and trading styles. Visual signals include green and red dots for buy and sell order block signals, and horizontal lines marking liquidity pools. Additional features include sentiment indication with confidence levels, candlestick pattern analysis for correction probabilities, and toggling of liquidity lines for chart clarity.
Recommended strategies include trading in the direction of order block signals aligned with sentiment for conservative approaches, or anticipating reversals near liquidity pools for aggressive trades. Risk management is supported by placing stop-loss orders relative to recent order blocks and setting take-profit targets at liquidity pools. The indicator can be combined with other tools like volume and moving averages for confirmation.
Отзывы покупателей
5 | 100 % | |
4 | 0 % | |
3 | 0 % | |
2 | 0 % | |
1 | 0 % |


![Логотип продукта "Gaussian Channel [Iridio Capital]"](https://cdn.ctrader.com/image/webp/7c039209-5573-4a54-a072-f9528b503103_41960)


