
คำอธิบาย
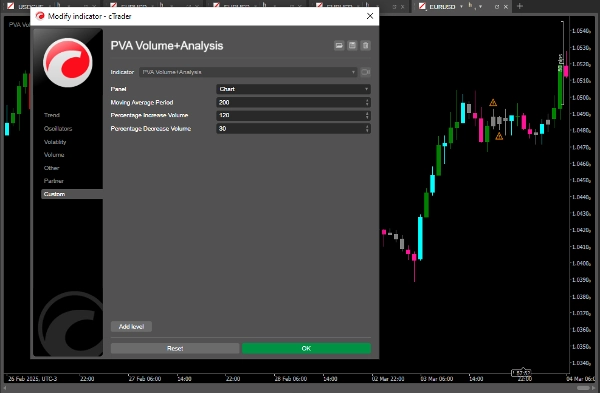
PVA (การวิเคราะห์ราคา-ปริมาณ) เป็นแนวทางการวิเคราะห์ทางเทคนิคที่ศึกษาความสัมพันธ์ระหว่างราคาและปริมาณการซื้อขายของสินทรัพย์ทางการเงิน แนวคิดหลักของ PVA คือปริมาณการซื้อขายสามารถให้ข้อมูลสำคัญเกี่ยวกับความแข็งแกร่งและทิศทางของแนวโน้ม ช่วยให้นักเทรดตัดสินใจได้อย่างมีข้อมูลมากขึ้น
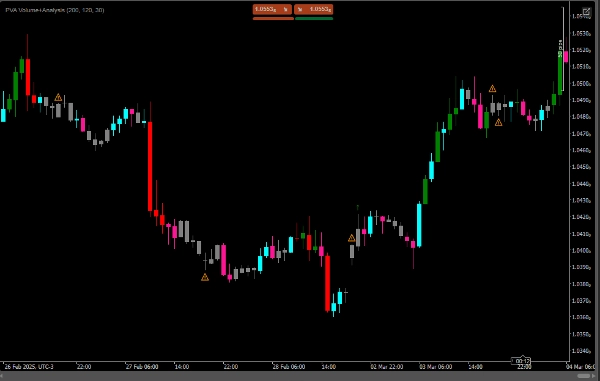
- ปริมาณเพิ่มขึ้นพร้อมกับราคาที่เพิ่มขึ้น: บ่งชี้แนวโน้มขาขึ้นที่แข็งแกร่ง และแสดงสัญลักษณ์สีเขียว (ลูกศรขึ้น)
- ปริมาณเพิ่มขึ้นพร้อมกับราคาที่ลดลง: บ่งชี้แนวโน้มขาลงที่แข็งแกร่ง และแสดงสัญลักษณ์สีแดง (ลูกศรลง)
- ปริมาณลดลงพร้อมกับราคาที่เพิ่มขึ้น: บ่งชี้ว่าแนวโน้มขาขึ้นอาจกำลังสูญเสียความแข็งแกร่ง และแสดงสัญญาณเตือนสีส้ม (สัญลักษณ์เตือน)
- ปริมาณลดลงพร้อมกับราคาที่ลดลง: บ่งชี้ว่าแนวโน้มขาลงอาจกำลังสูญเสียความแข็งแกร่ง และแสดงสัญญาณเตือนสีส้ม (สัญลักษณ์เตือน) เช่นกัน
- หากปริมาณลดลงในช่วงการเคลื่อนไหวขึ้นหรือลง จะมีการวาดเครื่องหมายเตือน (⚠️)
สรุป
- A green up arrow appears when volume increases alongside rising prices, indicating a strong uptrend.
- A red down arrow signals a strong downtrend when volume increases as prices fall.
- An orange warning symbol alerts when volume decreases during rising or falling prices, suggesting the current trend may be weakening.
- A general alert mark (⚠️) is displayed if volume declines during either upward or downward price movements.
This indicator assists traders by highlighting the interplay between price and volume, offering insights into the momentum behind market trends. It is designed for use in technical analysis to support more informed trading decisions.
รีวิวจากลูกค้า
5 | 100 % | |
4 | 0 % | |
3 | 0 % | |
2 | 0 % | |
1 | 0 % |


