
Golden Boom And Crash Spike Detector
Indikator
15 pembelian
Versi 2.0, Apr 2026
Windows, Mac
5.0
Ulasan: 3
Penerangan
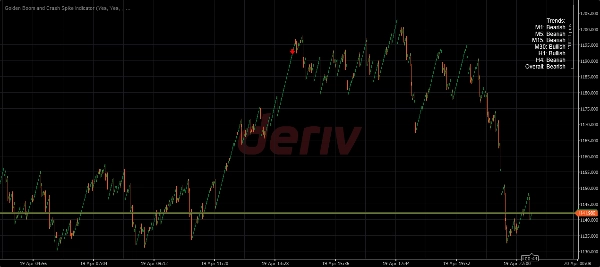
Pengesan Lonjakan Boom dan Kemalangan Emas adalah penunjuk dagangan sintetik canggih yang menggabungkan pengesanan lonjakan berasaskan AI proprietari dan analisis tindakan harga untuk memberikan isyarat dagangan berkemungkinan tinggi dengan ketepatan yang tiada tandingan.
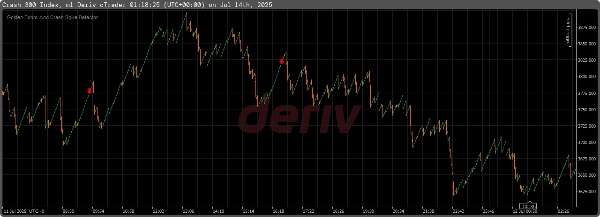
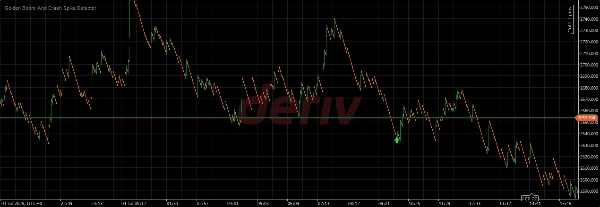
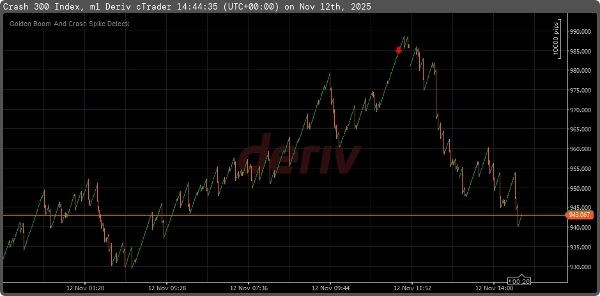
- Penting( Gunakan hanya pada Crash 300, Boom 300 (M1 jangka masa satu minit)
- Mengenal pasti lonjakan berkemungkinan tinggi dengan anak panah beli/jual yang tidak dicat semula pada carta
- Menghantar pemberitahuan ke telefon dan komputer
- Berfungsi pada broker Deriv
- Deposit minimum $30
- Memaparkan arah aliran dari M1 ke H4
- Menghantar tahap hentian rugi, ambil untung (Tp1, Tp2 ,Tp3 ) dan arah aliran ke telefon dan komputer
- Memaparkan kotak mesej di skrin dan pemberitahuan pop up standard
- Memainkan pemberitahuan bunyi apabila isyarat baru dijana
Ringkasan
Ringkasan AI
Golden Boom and Crash Spike Detector is a trading indicator designed specifically for the Crash 300 and Boom 300 indices on the 1-minute (M1) timeframe. It uses AI-driven spike detection combined with price action analysis to identify high-probability market spikes. The tool provides non-repainting buy and sell arrows directly on the chart, helping traders spot potential entry points. It integrates with Deriv platforms and supports sending notifications—including stop loss, take profit levels (Tp1, Tp2, Tp3), and trend direction—from M1 up to H4 timeframes to both phone and computer. The indicator also features on-screen message boxes, standard pop-up alerts, and sound notifications when new signals are generated. It requires a minimum deposit of $30 on the Deriv broker. This tool is intended to assist traders focusing on synthetic indices by delivering timely and actionable spike signals with trend context.
Profil indikator
Ulasan pelanggan
5.0
Ulasan: 3
5 | 100 % | |
4 | 0 % | |
3 | 0 % | |
2 | 0 % | |
1 | 0 % |
Ulasan pelanggan
July 17, 2025
Simple market helper for a more controlled workflow. It helps with handling gold setups with more structure, but gold can move fast, so DD and position sizing matter a lot. For gold, I would use 0.5 percent risk, a 1.5R target and DD under 3 percent before scaling. I would still keep manual review in the process.
July 16, 2025
July 16, 2025
Not bad for a trial around gold trading. The useful part is handling gold setups with more structure, with the numbers checked before scaling. The setup is easier to judge after 25 XAUUSD trades, especially if ROI sits around 4 to 6 percent. Gold volatility can make one bad trade expensive, so a 1 percent cap per trade feels sensible.
Perbincangan
Soalan Lazim
Forex
Signal
Indices
SMC
BOS
AI
Produk yang tersedia melalui cTrader Store, termasuk bot dagangan, indikator dan plugin, disediakan oleh pembangun pihak ketiga dan diberikan akses untuk tujuan maklumat dan teknikal sahaja. cTrader Store bukan broker dan tidak memberikan nasihat pelaburan, syor peribadi atau sebarang jaminan prestasi masa hadapan.
Lebih banyak produk daripada penulis ini


Harga
23
Jualan