
Penerangan
🚀 Lebih 10,000 pedagang sudah menggunakan penunjuk TERBAIK kami 🏆
Temui mengapa profesional memilih kami – alat paling berkuasa di cTrader (penunjuk, algoritma, dan cBots) menanti anda.
👉 Dapatkan semua sistem TERBAIK kami di sini:
_______________________________________________
📌 Penunjuk Struktur Pasaran
· ✅ AdvancedMarket Structure: Bos, Choch, SwinLevels, Order Blocks, Market Structure& Liquidity Finder
· 🔄 Dynamic Market StructureAnalysis of Turning Points
· 🧱 Order Block
· ⚖️ Market Imbalance
· ⛓️ BOS & CHOCH
· 🧠 ICT Power of 3
_______________________________________________
🔚 Sistem Keluar Pintar
_______________________________________________
📐 Penunjuk ZigZag
· 🔍 ZigZag Price LiquidityProjection
· ➖ ZigZag
· 🎯 Penjejak Zig-Zag Extremity
_______________________________________________
🧱 Penunjuk Sokongan & Rintangan
· 🟩 SmartTrend Support &Resistance Lines
· 🧱 Semua Tahap Sokongan dan Rintangan
_______________________________________________
📊 Penunjuk Trend & Saluran
· 📊 Supertrend
· ⚡Penganalisis Momentum Trend
_______________________________________________
💧 Alat Isipadu & Kecairan
_______________________________________________
⚡ Penunjuk Momentum & RSI
· 🔎 Multi-Level Candle Bias
Penjejak
_______________________________________________
🔮 Alat Ramalan & Unjuran
· 📐 Ramalan Berdasarkan Linreg& ATR
· 📏 Regresi Linear FibonacciMulti-timeframe
· 📈 Pemproyektor Aliran Pasaran Berkuasa Isipadu
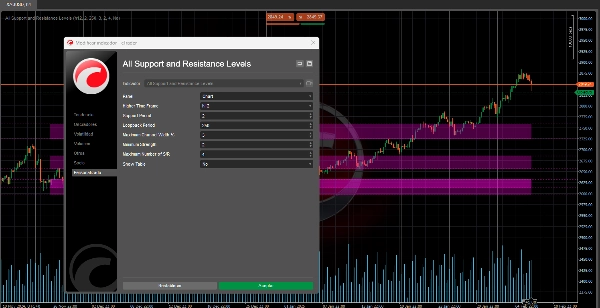
Algoritma ini adalah penunjuk sokongan dan rintangan lanjutan yang direka untuk membantu anda mengenal pasti tahap utama dalam pasaran.
Kelebihan utamanya ialah ia membolehkan anda melihat tahap sokongan dan rintangan dari mana-mana jangka masa (seperti harian, mingguan, atau bulanan) terus pada carta yang anda analisis, walaupun ia pada jangka masa yang berbeza (contohnya, 15 minit atau 1 jam). 📊⏰
Untuk apa ia? 🎯
Kenal pasti zon utama pasaran:
- Mengesan tahap di mana harga mungkin berhenti, memantul, atau pecah dengan kekuatan. 🛑↗️↘️
- Membantu anda membuat keputusan yang lebih bermaklumat mengenai kemasukan, keluar, dan stop-loss. 💡📈📉
Menganalisis pelbagai jangka masa tanpa menukar carta:
- Melihat tahap penting dari jangka masa yang lebih tinggi (seperti harian atau mingguan) semasa berdagang pada jangka masa yang lebih rendah (seperti 15 minit atau 1 jam). 🕒📅
- Memberi anda pandangan pasaran yang lebih luas tanpa sentiasa menukar carta. 🌍🔍
Utamakan tahap yang signifikan:
- Penunjuk mengkategorikan tahap sokongan dan rintangan berdasarkan "kekuatan" mereka, bermakna berapa kerap harga berinteraksi dengan mereka pada masa lalu. 💪📊
- Ini membantu anda memberi tumpuan kepada tahap yang paling relevan dan boleh dipercayai. 🎯✅
Bagaimana logiknya berfungsi? 🧠⚙️
Pengumpulan Data:
- Penunjuk mengambil harga tinggi dan rendah dari jangka masa tertentu (harian, mingguan, dll.). 📈📉
- Data ini digunakan untuk mencari corak utama dalam tingkah laku harga. 🔍📊
Pengesanan titik utama (pivot):
- Ia mengenal pasti harga tempatan tertinggi dan terendah—titik di mana harga mencapai puncak atau lembah berbanding harga berdekatan. ⛰️🌄
- Titik ini adalah calon untuk menjadi tahap sokongan atau rintangan. 🎯📌
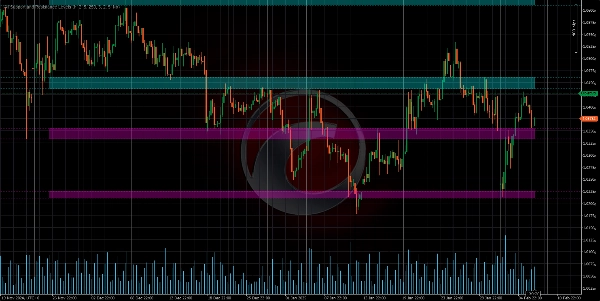
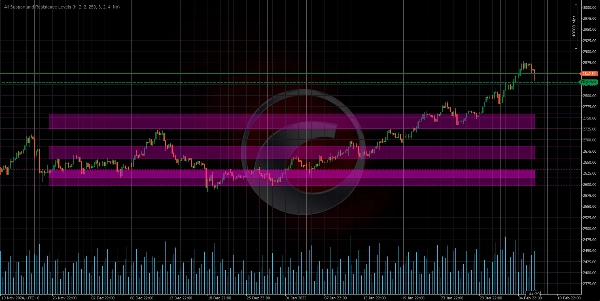
Pengelompokan tahap:
- Tahap berdekatan digabungkan untuk membentuk zon sokongan atau rintangan, bukan garis tepat. 🟦🟧
- Ini mencerminkan idea bahawa sokongan dan rintangan adalah kawasan, bukan titik tepat. 📏🎯
Pengiraan kekuatan tahap:
"Kekuatan" tahap ditentukan oleh dua faktor:
- Kekerapan sentuhan: Berapa kali harga telah menyentuh atau hampir dengan tahap itu pada masa lalu. 🔄📊
- Pengelompokan titik utama: Berapa banyak harga tinggi atau rendah yang berhampiran dengan tahap itu. 🔗📈
Tahap dengan kekuatan lebih besar dianggap lebih signifikan. 💪🎯
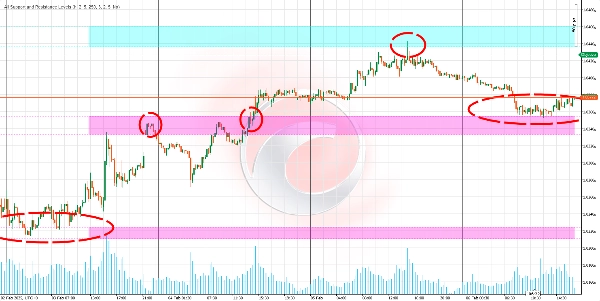
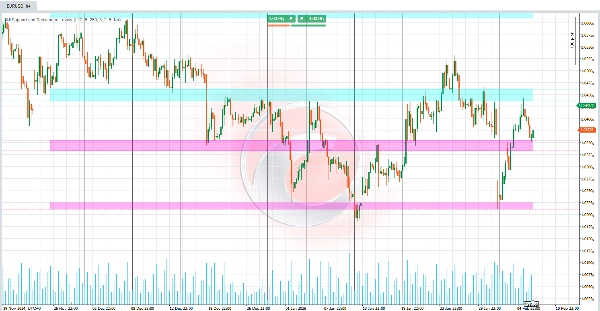
Visualisasi carta:
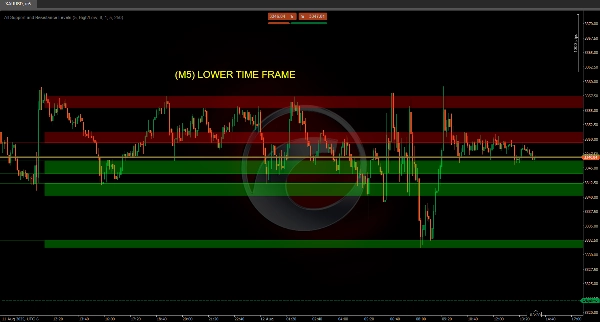
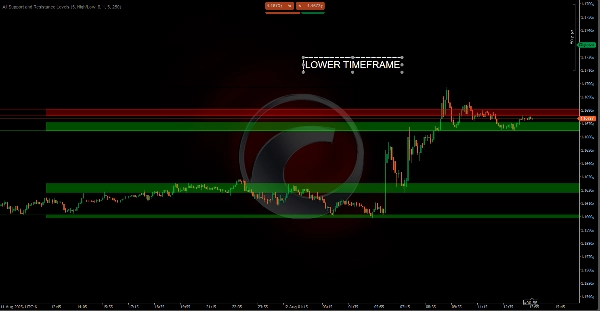
- Tahap dilukis sebagai garis mendatar atau zon berwarna pada carta. 🎨📊
- Warna setiap tahap bergantung pada kedudukan harga semasa:
-
- Rintangan: Jika harga di bawah tahap. 🔴
- Sokongan: Jika harga di atas tahap. 🟢
- Dalam julat: Jika harga berada dalam julat tahap. 🟡
Bagaimana anda boleh melihat jangka masa berbeza pada carta anda? 🕒📊
Sokongan dan rintangan dari jangka masa lebih tinggi pada carta jangka masa lebih rendah:
- Contohnya, jika anda menganalisis carta 15 minit, penunjuk boleh menunjukkan tahap utama dari jangka masa harian atau mingguan. 🕒📅
- Ini membolehkan anda melihat tahap konteks lebih tinggi yang penting tanpa meninggalkan carta semasa anda. 🌍🔍
Sokongan dan rintangan dari jangka masa lebih rendah pada carta jangka masa lebih tinggi:
- Walaupun kurang biasa, anda juga boleh melihat tahap dari jangka masa lebih kecil (seperti 1 minit atau 5 minit) pada carta jangka masa lebih tinggi (seperti harian atau mingguan). 🕒📅
- Ini boleh berguna untuk analisis lebih terperinci dalam konteks yang lebih luas. 🔍📊
Ringkasan
The indicator analyzes price data by collecting highs and lows from specified timeframes, identifying local pivot points where price peaks or valleys occur. These points are grouped into zones representing support or resistance areas rather than precise lines. Each level is assigned a strength score based on the frequency of price touches and the clustering of key points, helping users prioritize the most significant and reliable levels.
Visualized on the chart as horizontal lines or colored zones, the indicator uses color coding to indicate the price's position relative to each level: red for resistance (price below level), green for support (price above level), and yellow when price is within the level’s range. This tool assists traders in making informed decisions on entries, exits, and stop-loss placements by highlighting where price may stop, bounce, or break with strength.
Ulasan pelanggan
5 | 50 % | |
4 | 0 % | |
3 | 0 % | |
2 | 0 % | |
1 | 50 % |


