
Opis
Wskaźniki Pinescriptlabs Store: Pinescriptlabs Store cBots : (cBot) Gold & BTC BreakoutSession Pivots(nowy)
Prognoza oparta na Linreg & ATR
SmartTrend Wsparcie &
Opór
Linie
Dynamiczna
Struktura Rynku
Analiza
Punktów
Zwrotu
Punktów
Fibonacci
Regresja
Liniowa
Wielookresowa
Wielopoziomowy
Śledzenie Świec
Tracker
Auto
Wsparcie i
Opór
Trend
Linie
Wszystkie
Poziomy Wsparcia i
Opór
Poziomy
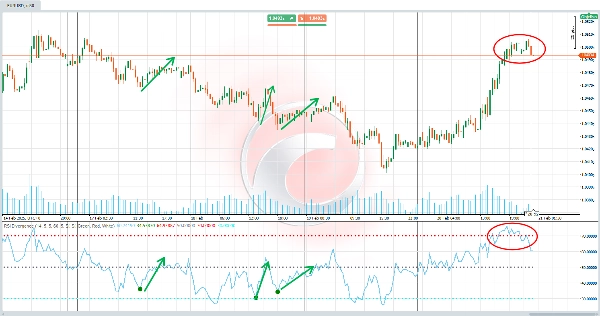
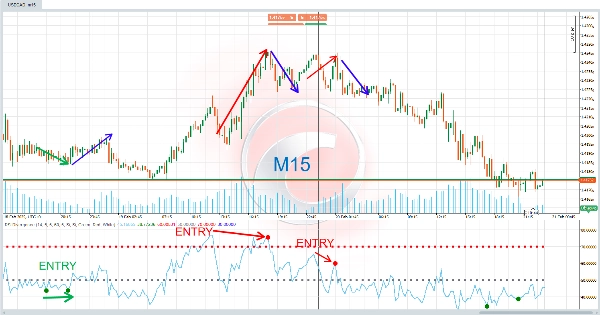
Wskaźnik RSI Divergence to zaawansowane narzędzie analizy technicznej zaprojektowane do wykrywania dywergencji między ceną a Indeksem Siły Względnej (RSI) . Te dywergencje są silnymi sygnałami, które mogą przewidzieć zmiany kierunku rynku, czyniąc go nieocenionym narzędziem dla traderów technicznych. 🔍💡
⚙️ Jak to działa?
Ten wskaźnik działa na zasadzie, że cena i RSI nie zawsze poruszają się synchronicznie. Gdy pojawia się dywergencja, oznacza to, że cena wysyła sygnał sprzeczny z podstawowym trendem RSI. Może to być wczesne ostrzeżenie, że obecny trend może tracić na sile.
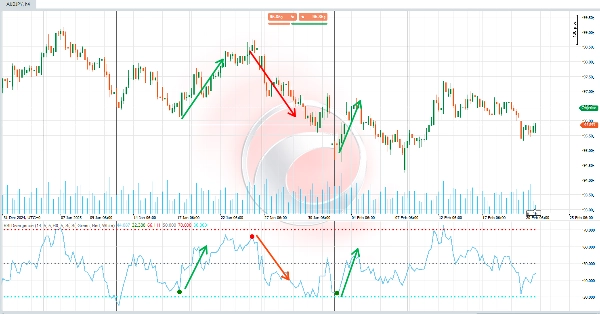
- Dywergencja bycza (trend wzrostowy) 📈 :
Występuje, gdy cena tworzy niższe dołki , ale RSI tworzy wyższe dołki . Sugeruje to, że mimo spadku ceny, momentum wzrostowe może zyskiwać na sile, co potencjalnie prowadzi do odwrócenia trendu w górę. ✅ - Dywergencja niedźwiedzia (trend spadkowy) 📉 :
Występuje, gdy cena tworzy wyższe szczyty , ale RSI tworzy niższe szczyty . Sugeruje to, że mimo wzrostu ceny, momentum spadkowe może zyskiwać na sile, co potencjalnie prowadzi do odwrócenia trendu w dół. ❌
Wskaźnik automatycznie wykrywa te dywergencje i podkreśla je na wykresie za pomocą kolorów, linii i etykiet dla łatwej interpretacji. 🎯
💡 Do czego służy?
Ten wskaźnik jest szczególnie przydatny do:
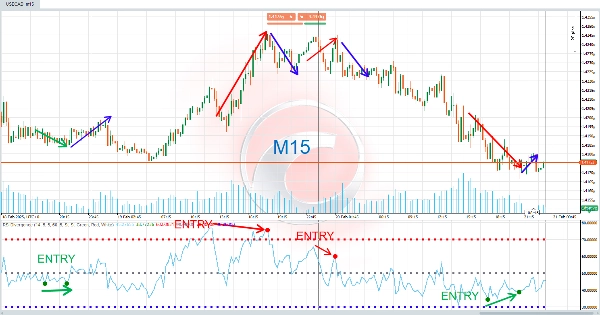
- Identyfikacji punktów wejścia i wyjścia : Dywergencje mogą działać jako sygnały kupna (bycze) lub sprzedaży (niedźwiedzie). 🛒💸
- Przewidywania zmian trendu : Dywergencje są wczesnymi sygnałami, że obecny trend może tracić na sile. ⚡
- Potwierdzania analizy technicznej : Może być używany wraz z innymi wskaźnikami lub formacjami świecowymi do weryfikacji decyzji handlowych. 🧠📊
Jest idealny zarówno dla traderów intraday, jak i inwestorów długoterminowych, ponieważ dywergencje mają zastosowanie do dowolnego interwału czasowego. ⏳📈
🛠️ Jak go używać?
- Początkowa konfiguracja:
-
- Dostosuj parametry według własnych potrzeb, takie jak okres RSI, zakresy wyszukiwania pivotów oraz kolory sygnałów. 🎨⚙️
- Włącz lub wyłącz wyświetlanie dywergencji byczych lub niedźwiedzich zgodnie z własnymi preferencjami. ✅❌
- Interpretacja sygnałów:
-
- Dywergencja bycza : Gdy na wykresie pojawi się zielony sygnał "D", oznacza to możliwą okazję do kupna. 🟩🛒
- Dywergencja niedźwiedzia : Gdy na wykresie pojawi się czerwony sygnał "D", oznacza to możliwą okazję do sprzedaży. 🟥🚫
- Dodatkowo rysowane są linie łączące punkty dywergencji, co ułatwia analizę wizualną. 📐🔗
- Podejmowanie decyzji:
-
- Wykorzystaj te sygnały do dostosowania swoich strategii, takich jak otwieranie pozycji, zamykanie istniejących transakcji lub dostosowywanie poziomów stop-loss. 🤝💼
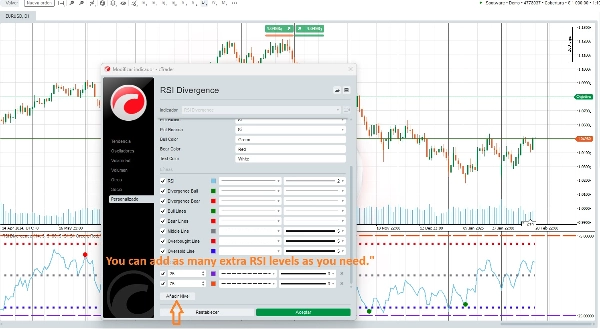
🆕 Zaawansowana personalizacja!
🌟 Możesz dodać tyle poziomów RSI, ile użytkownik chce 🌟
Ten wskaźnik pozwala na pełne dostosowanie doświadczenia handlowego. Możesz dodać wiele poziomów RSI, aby dopasować go do różnych strategii i stylów handlu. Na przykład możesz skonfigurować dodatkowe poziomy wykupienia i wyprzedania lub nawet dostosować okres RSI do różnych interwałów czasowych. 🔄📈📉
Podsumowanie
Designed for use on any timeframe, the indicator helps traders identify entry and exit points, anticipate trend changes, and confirm other technical analysis signals. Users can customize parameters such as RSI period, pivot search ranges, signal colors, and enable or disable specific divergence types. Additionally, multiple RSI levels can be added to tailor the indicator to various trading strategies and styles.
This tool is suitable for intraday traders and long-term investors across markets including cryptocurrencies (e.g., BTCUSD), commodities (e.g., gold, XAUUSD), and indices. It supports enhanced decision-making by providing early warnings of trend strength shifts based on RSI divergence analysis.
Opinie klientów
5 | 0 % | |
4 | 100 % | |
3 | 0 % | |
2 | 0 % | |
1 | 0 % |


