
説明
Half Trendインジケーターは、指定された期間の最近の高値と安値を比較して潜在的なトレンドの反転を検出および強調表示し、それに応じて「上昇」または「下降」のラインをプロットするように設計されています。オプションで各トレンド変化時に矢印を描画し、シグナル間のピップ差を表示することもできます。
- 高値/安値シリーズの選択
- インジケーターは、ローカルの最大値と最小値を追跡するために2つの価格シリーズ(デフォルトでは高値と安値)を使用します。
- 各シリーズに対して、
始値、終値、中央値など、異なる価格タイプを最高価格および最低価格を通じて選択できます。
- 移動平均と期間の計算
- 選択された平滑化タイプと振幅期間に基づく移動平均が、選択された「高値」と「安値」の両方の価格シリーズに適用されます。
- インジケーターは、現在のバーの価格をこれらの平滑化された高値/安値レベルと比較し、上昇トレンドから下降トレンド(またはその逆)に切り替えるかどうかを判断します。
- トレンド検出とプロット
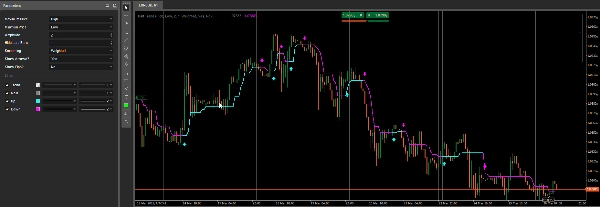
- インジケーターが上昇トレンドを識別した場合、上昇ライン(シアン)をプロットし、
Trendを+1に設定します。 - 下降トレンドを検出した場合、下降ライン(マゼンタ)をプロットし、
Trendを-1に設定します。 - メイン出力(グレー)は、現在のサポート/レジスタンスレベルを反映するように内部的に更新されます。
Trendは、トレンド方向を数値的に格納する不可視の出力シリーズです(+1または-1)。
- インジケーターが上昇トレンドを識別した場合、上昇ライン(シアン)をプロットし、
- 矢印とピップ計算
- 矢印を表示しますか? – 有効にすると、トレンド反転が検出された新しいバーごとにインジケーターが矢印を描画します。
- ピップを表示しますか? – 有効にすると、最後のシグナルと新しいシグナル間のピップ差を計算して表示し、チャート上に小さなラベルとトレンドラインを描画します。
概要
AIによる概要
The Half Trend BT indicator detects potential trend reversals by analyzing recent highs and lows over a specified period. It compares two selected price series—typically High and Low, but configurable to other price types such as Open, Close, or Median—using moving averages based on chosen smoothing methods and amplitude periods. The indicator plots an "Up" line (cyan) when an uptrend is detected and a "Down" line (magenta) for a downtrend, while internally storing trend direction numerically (+1 or -1). A main output line (gray) reflects current support and resistance levels. Optional features include drawing arrows on bars where trend reversals occur and calculating pip differences between signals, which are displayed as labels and trendlines on the chart. This indicator supports multiple markets including Forex, indices, commodities, cryptocurrencies, and stocks.
インジケーターのプロフィール
カスタマーレビュー
4.3
レビュー: 3
5 | 33 % | |
4 | 67 % | |
3 | 0 % | |
2 | 0 % | |
1 | 0 % |
カスタマーレビュー
March 29, 2025
Clean idea for traders around chart reading. The useful part is adding confirmation before a trade, with the numbers checked before scaling. The cleaner reads should hold across 3 sessions, not just 1 good chart. It is stronger when a 1.5R target is realistic before the entry.
March 28, 2025
March 28, 2025
Decent tool for testing if the trader wants it makes market context easier to scan. It works best as support, not a final decision maker. I would test it on 2 timeframes, 20 signals and a 1R stop plan. it should not be used as a blind entry trigger.
ディスカッション
よくあるご質問
Prop
Forex
Signal
Indices
Commodities
Crypto
Stocks
cTrader Storeで入手可能な取引ボット、インジケーター、プラグインなどの商品は、第三者の開発者が提供するものであり、情報と技術の取得のみを目的としてご利用いただけます。cTrader Storeはブローカーではなく、投資助言や個人的な推奨を行うことも、将来のパフォーマンスを保証することもありません。


価格
48
販売
1.02K
無料インストール